本报告所提及市场、项目、币种等信息、观点及判断,仅供参考,不构成任何投资建议。
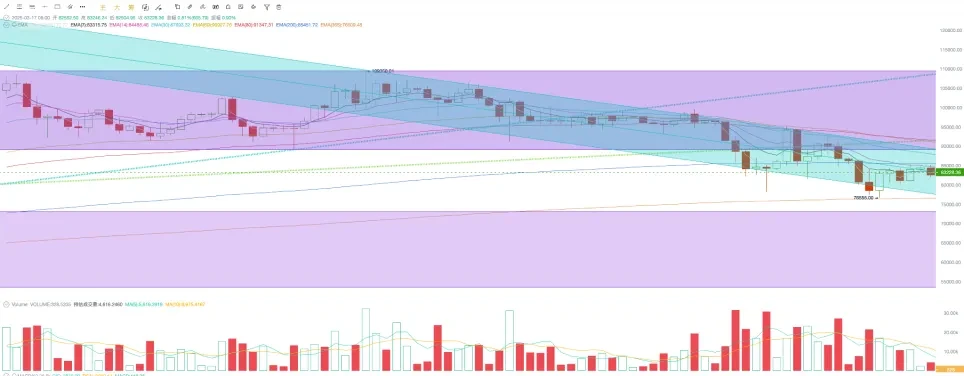
本周BTC开于80708.21美元,收于82562.57美元,全周上涨2.31%,振幅10.86%,成交量较上周继续下降。BTC价格跌运行于下降通道中,略有反弹。
美国公布了略微高出预期的CPI数据,俄乌战争亦有走向终结的进一步进展,使得美股和BTC得以迎来喘息之机。
但美估值仍然处于下跌探底之中,依历史数据仍有下行空间。因为推动估值下杀的调整原因——关税混乱可能引发通胀,从而推动美国经济进入“滞涨”状态的忧虑,并未消除,混乱制造者特朗普并未准备收手,而美联储主席仍在减持以数据为导向。
这种混乱和僵局,使得“滞涨”忧虑难消,拖得越久,估值下修空间越大。这是我们短期看淡BTC反弹的原因。
宏观金融及经济数据
上周美国公布了就业数据,非农就业人数小幅低于预期,失业率小幅上升,显示就业有放缓迹象,加剧了美国经济衰退的预期,市场在恐慌中大幅下跌。
本周,美国发布了最新CPI数据,2月未季调CPI同比升2.8%,略低于预期的2.9%,前值升3%;美国2月季调后CPI环比升0.2%,预期升0.3%,前值升0.5%。CPI数据低于预期,对冲了上周就业数据的恐慌,使得惊魂未定的市场暂时迎来喘息之机。
在上周大幅杀跌和本周CPI数据利好之下,美股由深跌暂时转好,收回一定跌幅,但全周仍然处于下跌态势。纳指仍处于250天线之下,周跌幅收窄至2.43%;标普500,收回至250天线之上;道琼斯跌3.07%,略微收回至250天线。
14日,美国密歇根大学发布3月消费者信心指数初值数据,显示消费者信心指数跌至57.9,远低于市场预期的63.1,较前值64.7显著下降。与此同时,一年期通胀率预期初值升至4.9%,超出预期的4.2%,较前值4.3%亦有明显上升。显示美国消费者对经济前景的担忧加剧。
密歇根大学的消费者信心指数提前反应了特朗普混乱、鲁莽的关税政策对终端消费者的信心冲击。令市场和美国企业主痛苦的是,美国总统仍然乐此不疲地形式其权力,可能要更差的市场反馈、更长时间的不确才会有所转变。
周五,美股和欧股甚至俄罗斯股市都出现了较大反弹,主要得益于市场“俄乌战争”取得一定进展——双方拟达成为期30天的停火协议。
特朗普以政府雇员裁员和关税战实现“经济衰退”以逼迫美联储的“阴谋论”正迎来越来越大的市场,至少结果上看来是这样。
这些都是难以确认的动因猜测,更客观的判断可能是——本轮美股调整的本质是降息中继引发的估值调整。S&P 500 Shiller CAPE Ratio在12月达到顶峰37.80倍,逼近疫情大放水后于2021年11月创下的近年高点38.71倍。这一高估值包含了“特朗普交”易和AI产业高速发展的预期。2025年以来,DeepSeek“刺破”AI的增长神话,特朗普关税政策和裁员行动粉碎了经济增长预期,使得市场难以承受如此高的估值,转而掉头向下修正,以寻求新平衡。
目前,纳指、标普500和道琼斯最大跌幅度分别达到14.59%、10.36%和9.79%,均已处于250日线附近,进入“市场修正”区间(10%-20%下跌),但并不意味着市场已经完成出清。目前S&P 500 Shiller CAPE Ratio在34.75倍,较高点下跌8.07%左右,依20年来历史规律如果继续下探将回到32.89倍,将再下跌5%以上,如果回到均值27.25倍,则仍有超过21%的回撤空间。当然我们判断出现这种深度调整的概率极低,类似美国总统和鲍威尔丧失理智任美国经济真正走向衰退才有可能出现。
在混乱之中,避险情绪升温,推动金价一度突破3000美元/盎司大关。美元指数在创出心底后小幅回升,2年美债收益率涨0.7%,10年期美债收益率涨0.37%,显示亦部分资金开始撤出美债开始抄底股市。
总之,目前美国股市已经进入修正空间,但通胀、降息前景仍然不明朗,尤其是特朗普关税和裁员的冲击仍未过去,使得市场仍然有较大概率继续向下修正,以平复混乱市场背景中的资产估值。受BTC Spot ETF联动,我们维持BTC将继续受制美股调整的判断,虽然BTC连续数日反弹重新回到83000美元一线,但未来两月仍有下探73000美元的可能性。
稳定币及BTC Spot ETF
相较上周双通道净流入出12.82亿美元,本周双通道供给流入2.37亿美元,流入规模大幅减小,具体表现为BTC Spot ETF流出 8.42亿,ETH Spot ETF流出1.84亿,稳定币流入12.64亿。
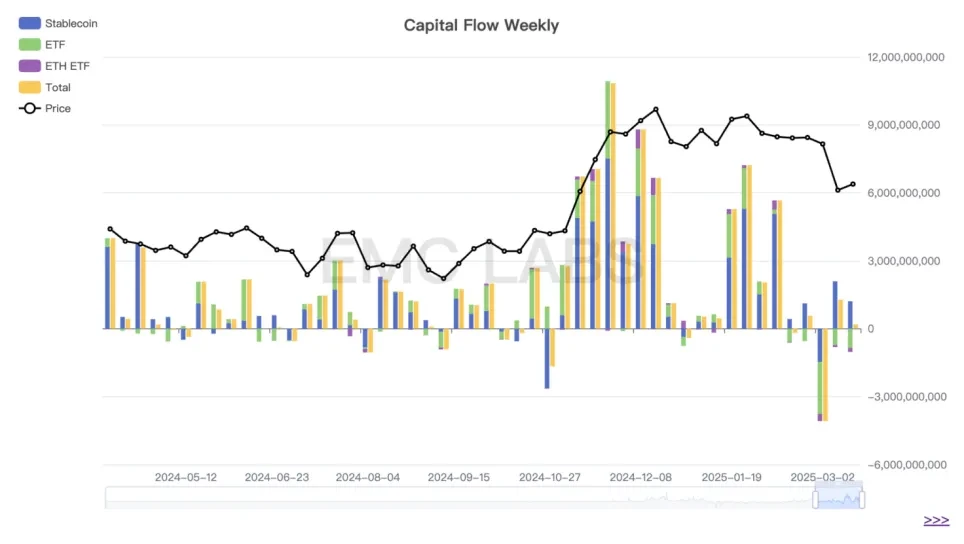
加密市场资金流入流出统计(eMerge Engine)
虽然稳定币流入规模在减小,而ETF通道流出有所增加,但存量资金进入交易所重新转化为买力,使得BTC的价格能够重返83000美元。目前,交易所存量资金略有反弹,这种反弹目前只可视作少量资金的抄底行为,并不足以成为推动市场翻转的力量。
抛压与抛售
据eMerge Engine数据显示,上周短手群体在继续杀跌止损,最大损失日在3月13日,但规模低于3月10日。
在浮盈浮亏方面,短手群体目前承担着平均9%的亏损,这其中包含大量的ETF持有者。在本轮下跌中,短手群体既是促发力量,也是亏损的主要承担者,后市的动荡中将继续承压,也可能是继续下探的抛压来源。
在3周下跌以来,长手群体已由减持转为增持,加仓约10万枚。另外一个值得关注的群体巨鲸也增持了近6万枚,成本在8万美元以下。在长周期里,这两个群体都是常胜将军,也起到市场稳定器的作用。
周期指标
据eMerge引擎,EMC BTC Cycle Metrics 指标为0.375 ,市场处于上升中继期。
EMC Labs(涌现实验室)由加密资产投资人和数据科学家于2023年4月创建。专注区块链产业研究及Crypto二级市场投资,以产业前瞻、洞察及数据挖掘为核心竞争力,致力于以研究和投资方式参与蓬勃发展的区块链产业,推动区块链及加密资产为人类带来福祉。
更多信息请访问:https://www.emc.fund
免责声明:本文章仅代表作者个人观点,不代表本平台的立场和观点。本文章仅供信息分享,不构成对任何人的任何投资建议。用户与作者之间的任何争议,与本平台无关。如网页中刊载的文章或图片涉及侵权,请提供相关的权利证明和身份证明发送邮件到support@aicoin.com,本平台相关工作人员将会进行核查。


