撰文:1912212.eth,Foresight News
2024 年 12 月市场自顶部跌落至今,行情已震荡数月,不少玩家在无尽的下跌趋势以及震荡行情中,损失惨重。市场杂音也在牛熊以及多空上分歧严重。宏观环境不稳,特朗普挥舞关税大棒,美联储降息仍遥遥无期,市场流动性在收紧,社区悲观情绪蔓延。
那么加密市场市场进展如何?倘若比特币仍有后续上扬空间,那么现在是行情阶段性的底部区间吗?
一、恐慌指数自今年 2 月以来低于 40
CMC 恐惧与贪婪指数是 CoinMarketCap 上用于衡量加密货币市场的整体情绪。该指数范围从 0 到 100,数值越低表示市场极度恐惧,数值越高表示市场极度贪婪。该指数可帮助投资者了解市场的情绪状态,从而计划买卖决策。此外,它还能提供市场是否被低估(极度恐惧)或高估(极度贪婪)的参考信息。
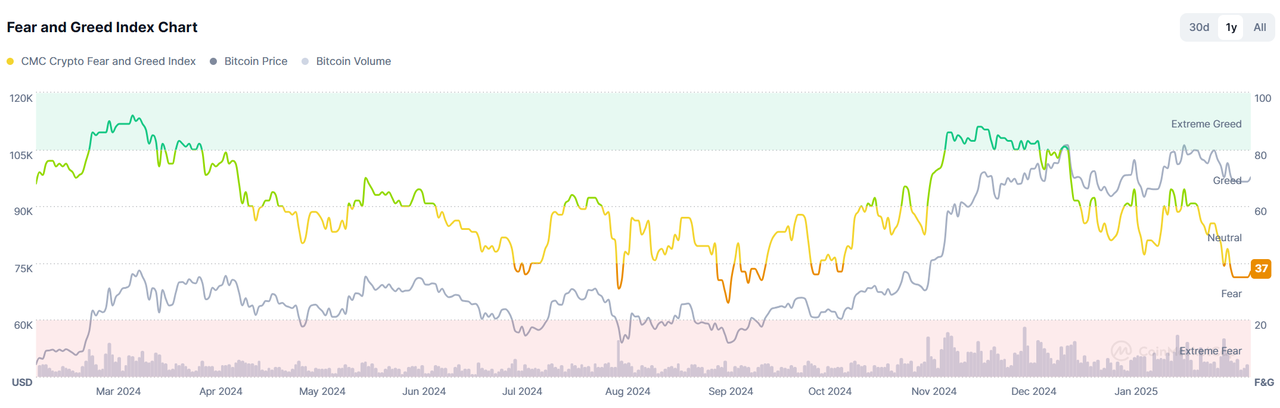
上图所示,2024 年 7 月至 10 月初,市场曾多次出现恐慌指数跌破 40 下方(恐慌),随后在当年的 11 月出现 FOMO 情绪,指数一度超 80,随后市场出现回落。目前,市场自今年 2 月初以来,恐慌指数再度跌破 40。
市场在恐慌指数越低之时,往往意味着可能币价可能处于阶段性底部区间。
二、比特币 7 日平均资金利率相较去年 12 月跌 85%
永续合约的 7 日平均资金利率可以作为观测市场情绪的重要指标之一。当市场行情火爆之时,往往资金利率居高不下,也往往是市场周期的顶部区间。反之,则往往成市场底部区间。
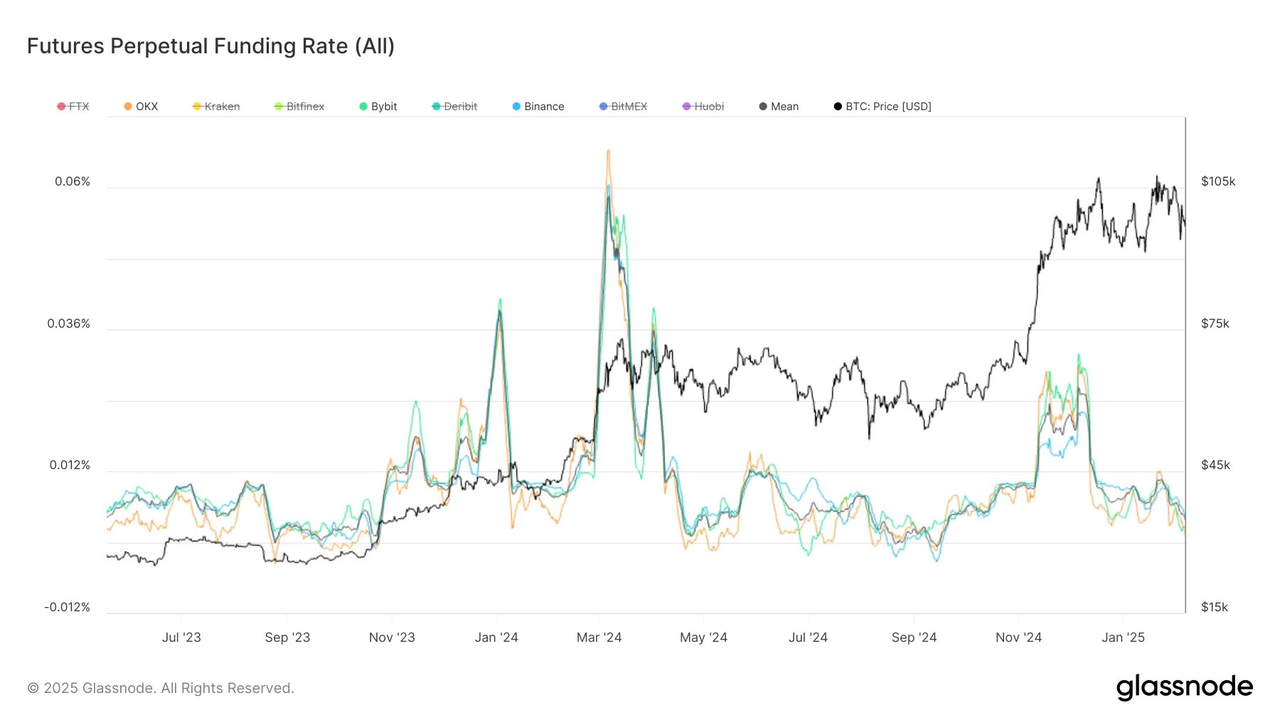
上图所示,2024 年 3 月 BTC 的 7 日平均资金费率一度超过 0.06%,表明市场做多资金愿支付高额成本给做空资金,市场情绪极度 FOMO,也成了当年 Q1 季度的最高点。2024 年 11 月至 12 月期间,其资金利率仍在 0.03% 上方,比特币也在此时一度突破 10 万美元关口,不过在行情起飞之前,比特币的 7 日平均资金利率在当年 5 月至 10 月曾一度出现负利率。
截止写稿时,资金费率一度达到 0.004%,相较于 12 月的峰值,跌去 85%。市场情绪处于悲观状态。
三、ETH 盈利比例创 4 个月以来新低
以太坊市值自 7 周前的局部高点已下跌 36%,导致处于盈利状态的 ETH 数量锐减。从日线收盘数据看,当前 ETH 盈利比例创 4 个月新低,盈利代币数量也降至 3 个月最低水平。
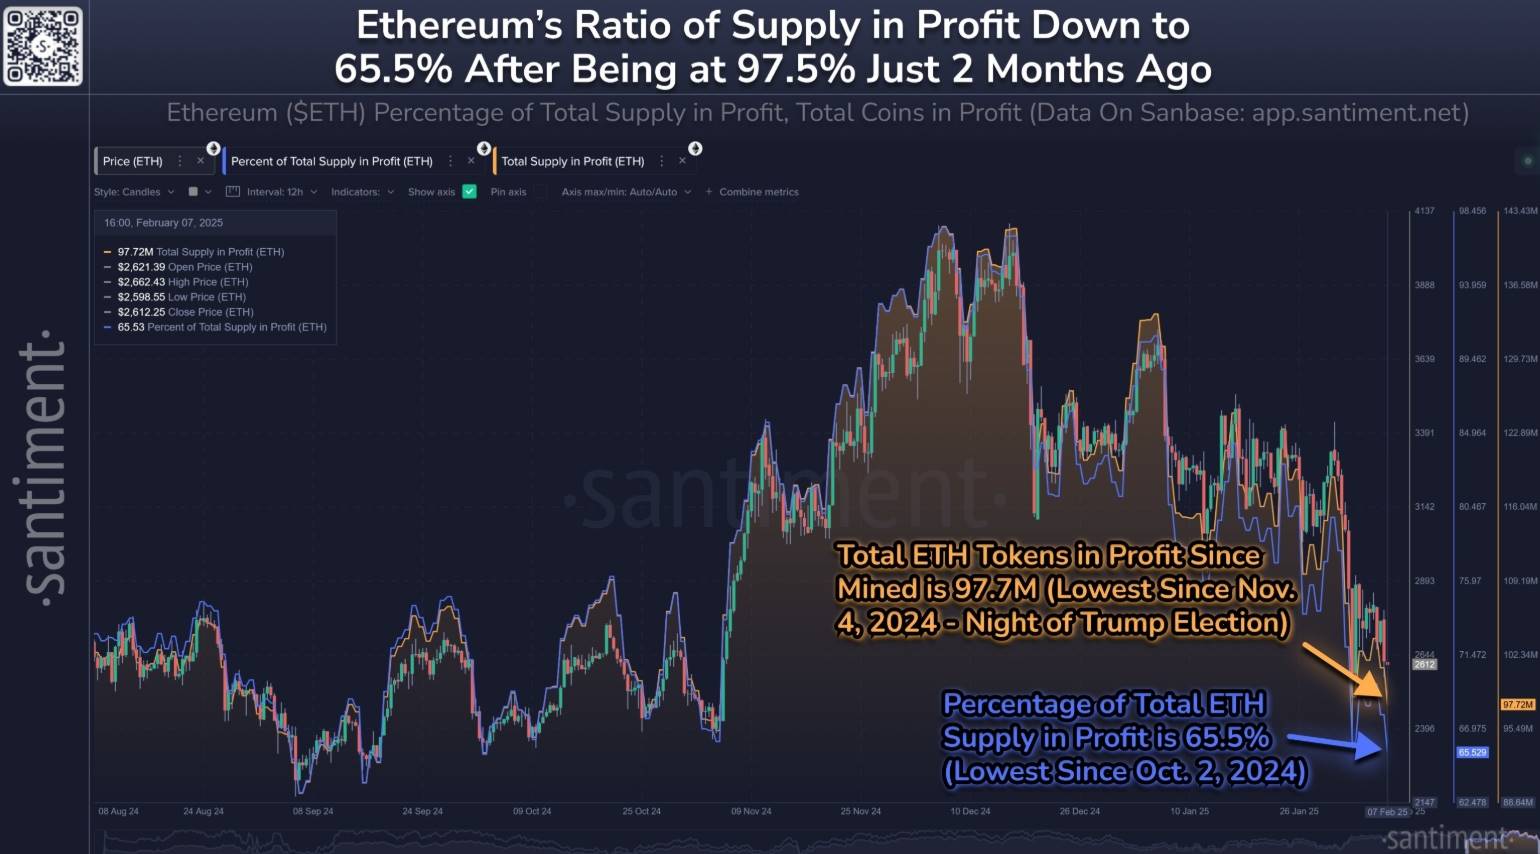
作为市值第二大的加密货币,以太坊表现逊于其他大盘币种,市场情绪已陷入显著负面。尽管当前充斥恐慌情绪(FUD)且散户持续抛售,但一旦加密市场企稳,以太坊或迎来反弹。
四、比特币矿工自今年 2 月初再次投降,挖矿难度不降反升
比特币矿工投降往往被视为市场底部的重要参考指标之一。矿工投降意味着市场挖出一枚比特币的盈利低于成本,历史数据看,往往比特币矿工投降之时,也是市场的底部区间。
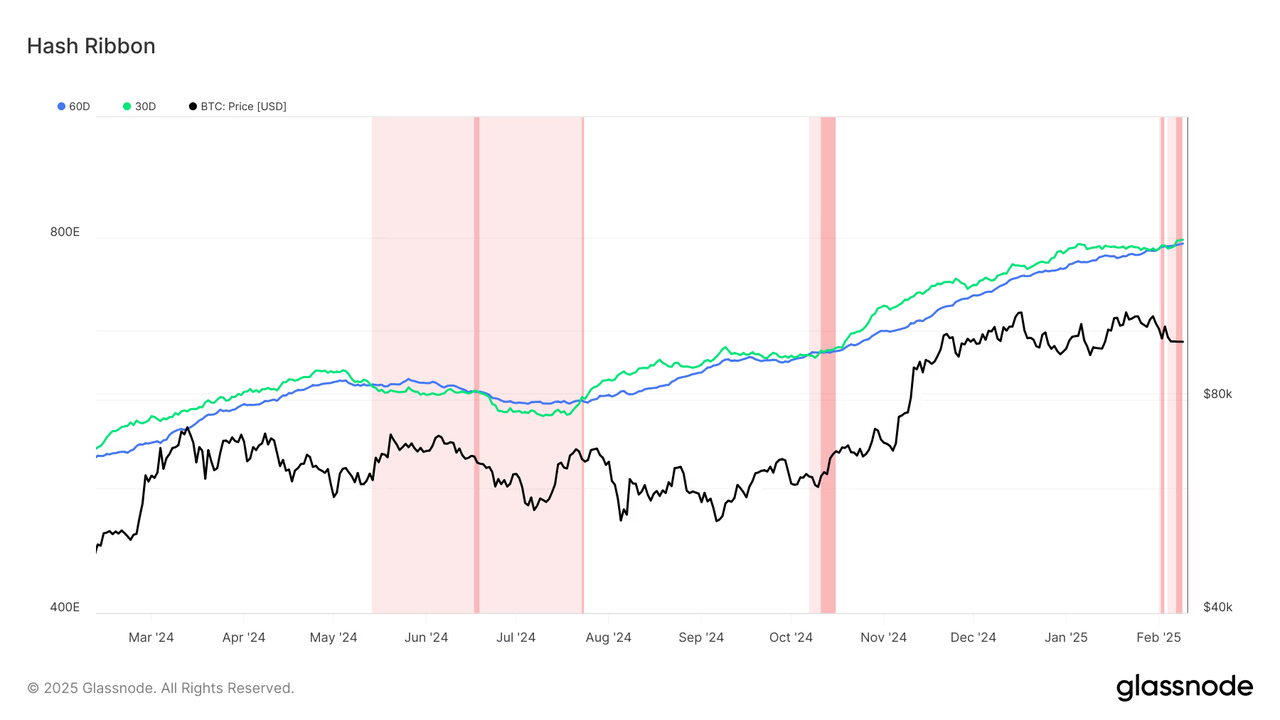
上图显示,2024 年以来,比特币矿工曾在今年 6 月、10 月都出现过投降。2025 年以来,比特币矿工首次自 2 月份开始出现投降。
与此同时,比特币挖矿的难度在近期却创下 114.7T 的历史新高。难度创新高通常表明矿工仍看好比特币的长期价值,否则不会持续投入算力。这可能对市场情绪带来一定的积极影响。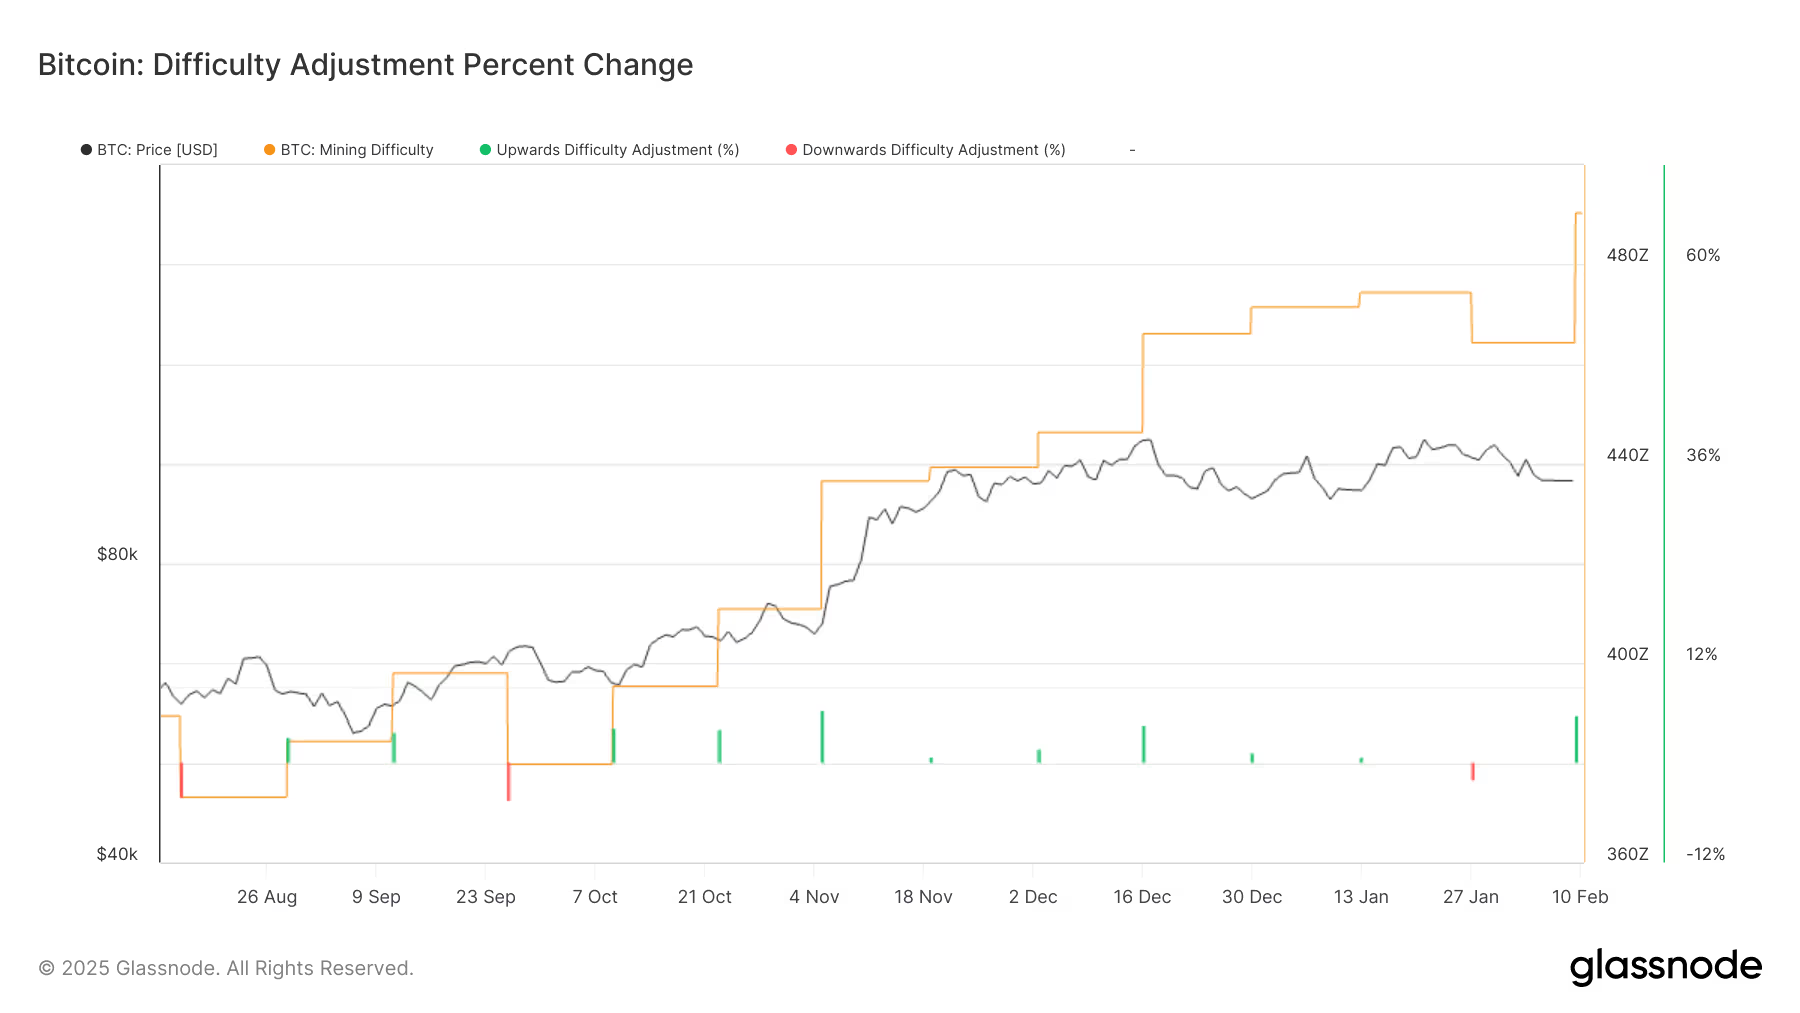
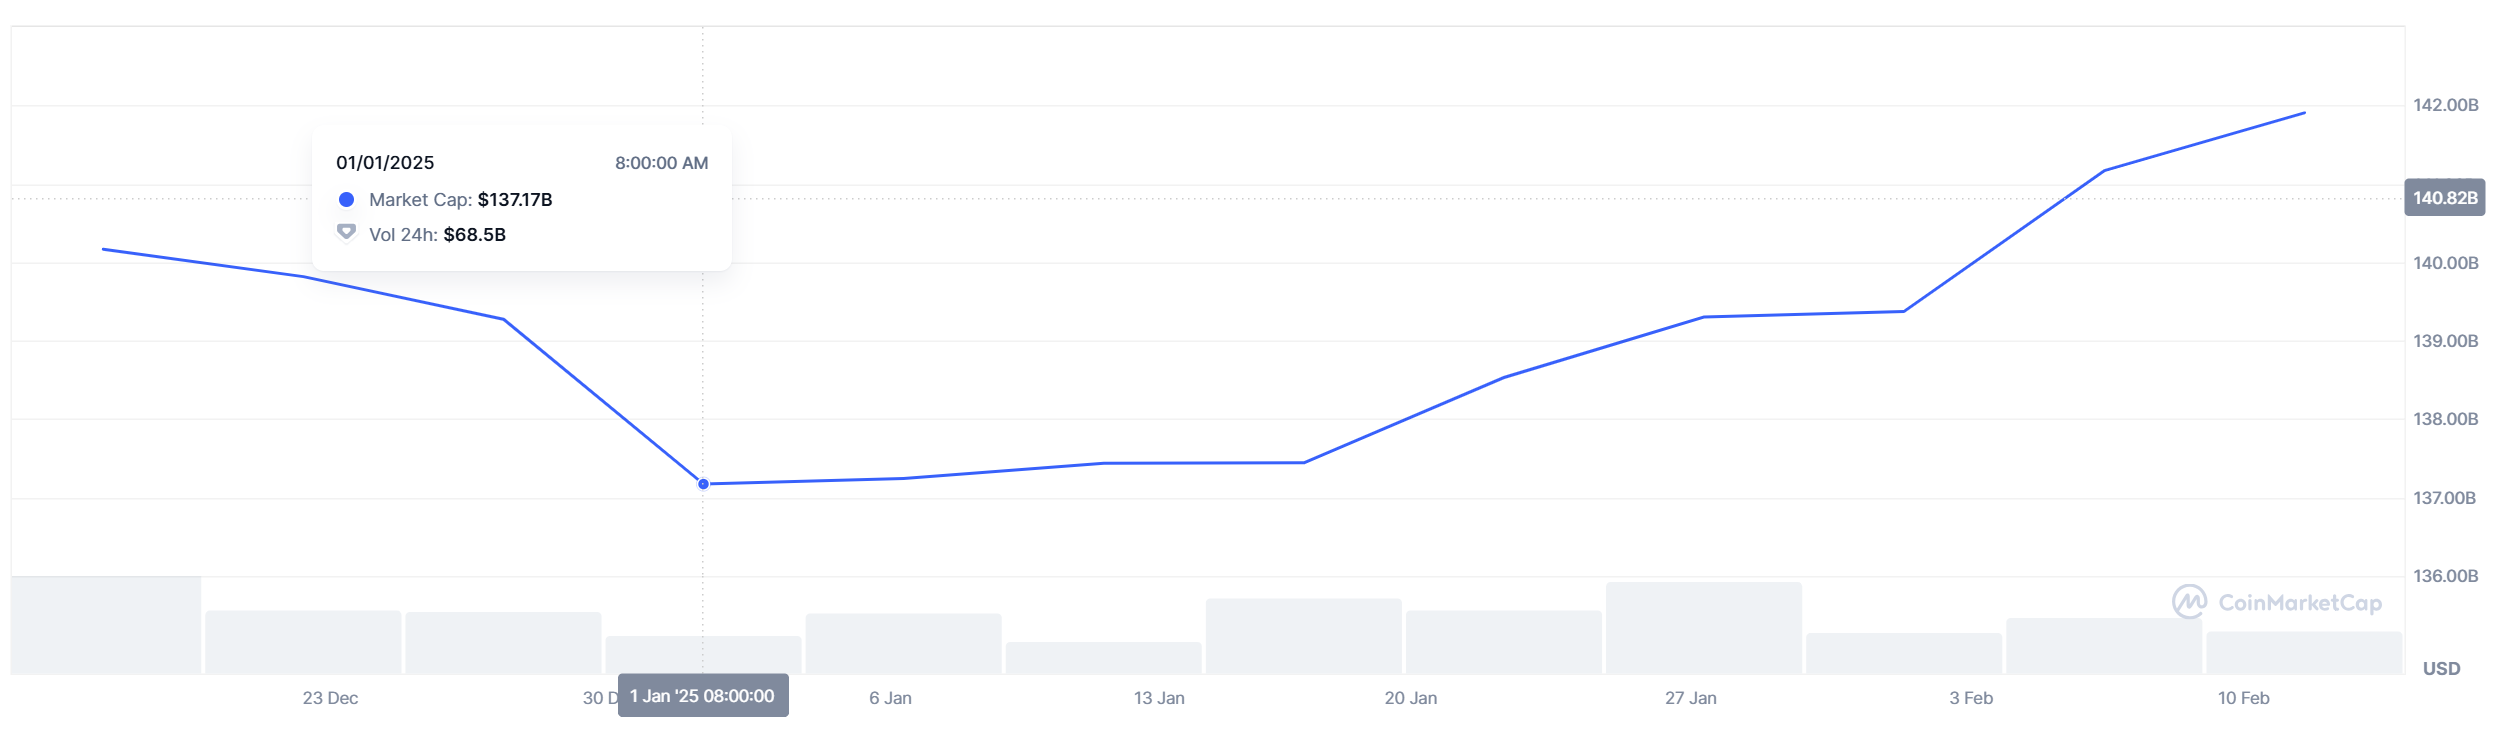
五、稳定币市值过去一月不降反升
稳定币数据是观察市场资金流入的重要参考数据之一,过去一个月,据 DefiLlama 显示,USDT 的市值增加 3.4%(46.76 亿美元),USDC 则狂增 22.73%(103.96 亿美元)。
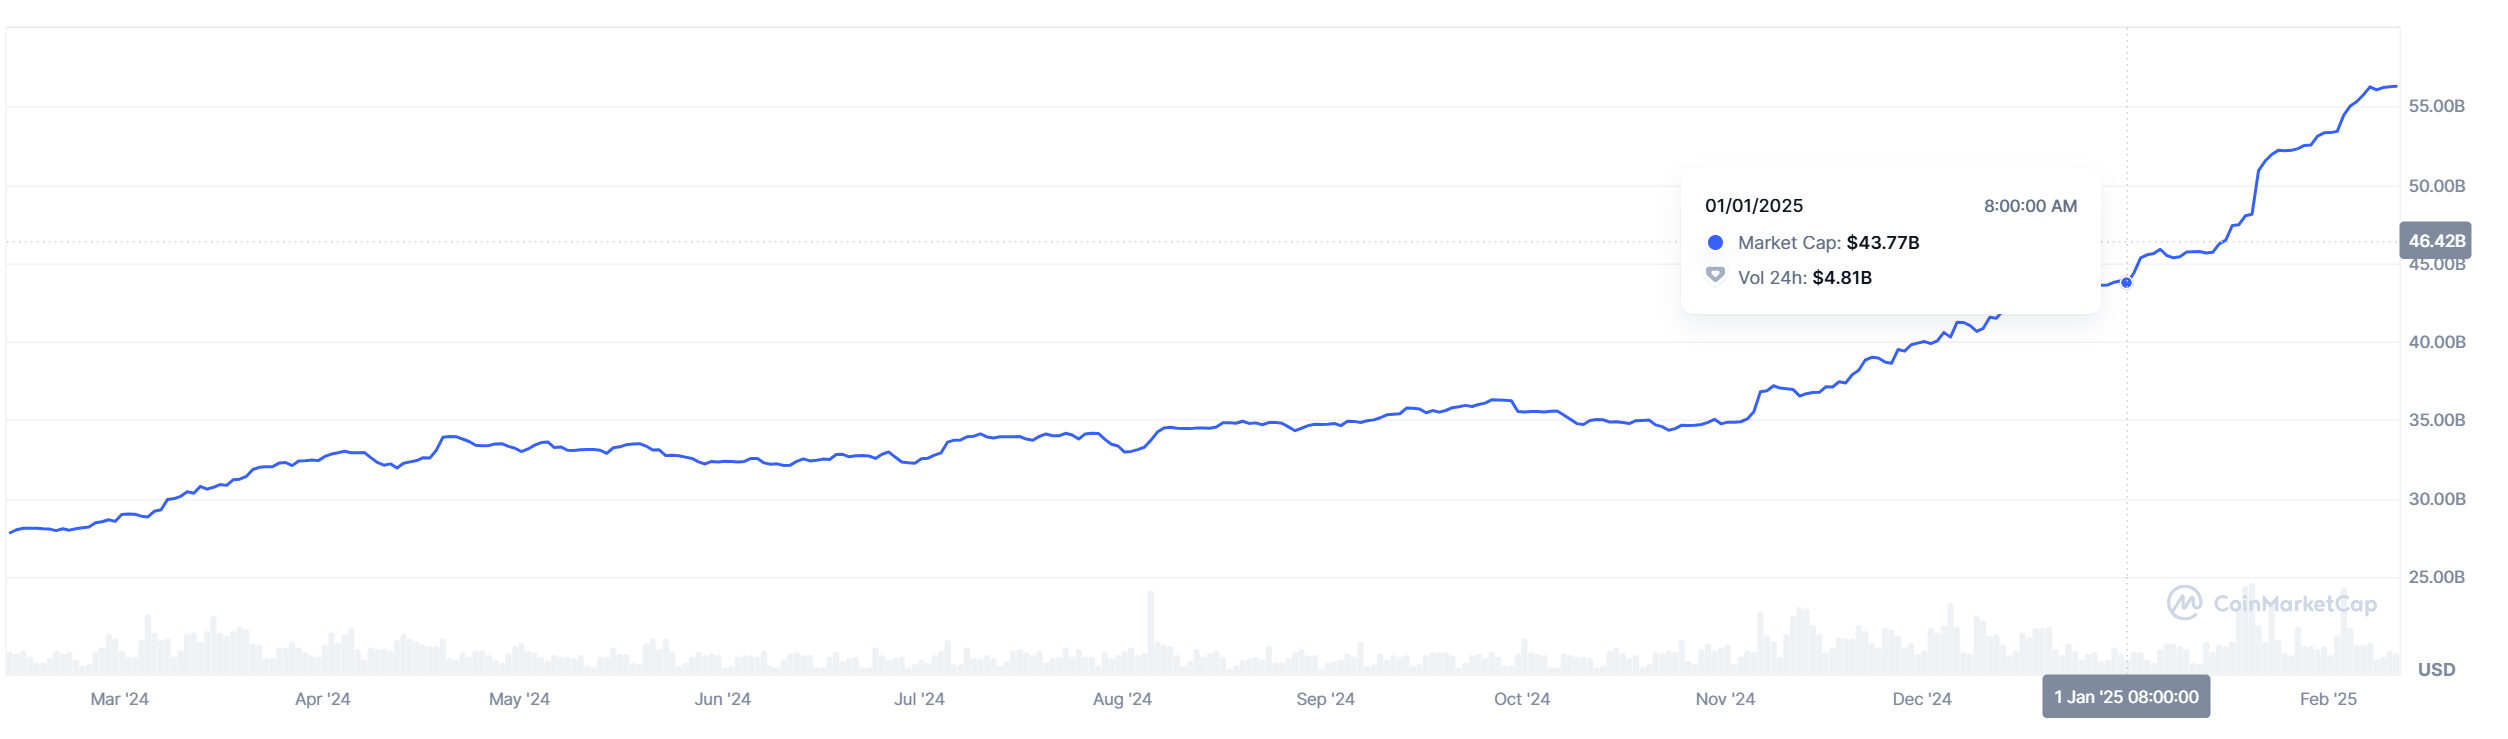
若从 2025 年 1 月 1 日算起,USDT 市值则从 1371.7 亿美元,已升至目前的 1419 亿美元,增加 47.3 亿美元。
USDC 数据则从 437.7 亿美元,增至如今的 562.8 亿美元。
小结
以上 5 大数据或暗示行情可能处于阶段性底部区间,至于行情将于何时脱离底部区间则难下断言。投资者值得注意的是,即便目前部分代币处于底部区间,部分无热度、无叙事、无基本面、不断巨额解锁的代币,难以获得资金关注,或将面临继续下跌的窘境。
免责声明:本文章仅代表作者个人观点,不代表本平台的立场和观点。本文章仅供信息分享,不构成对任何人的任何投资建议。用户与作者之间的任何争议,与本平台无关。如网页中刊载的文章或图片涉及侵权,请提供相关的权利证明和身份证明发送邮件到support@aicoin.com,本平台相关工作人员将会进行核查。


