作者:BitpushNews
近日市场陷入拉锯战,BTC 多空双方在 10 万美元和 9.6 万美元之间反复博弈,过去一周更是出现了大幅回踩,一度跌破 91,000 美元的支撑位,从波动性可以看出,投资者对短期走势的焦虑情绪正在不断升温。
长期持有者动向与市场信号
2 月 9 日,知名分析师 Maartunn 分享了一组链上数据:14,000 枚 7 至 10 年历史的比特币在链上发生了移动。
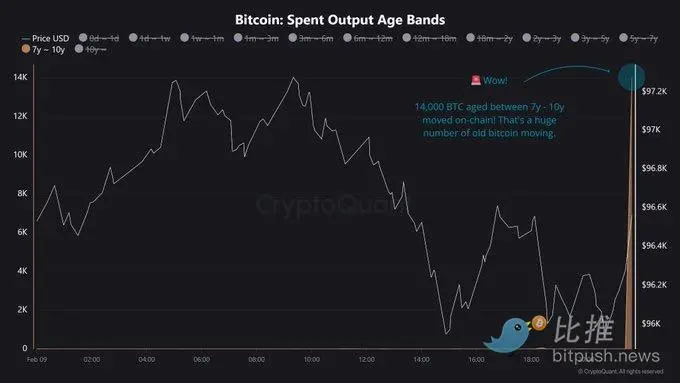
这种长期休眠的比特币重新进入流通通常被视为一个重要的信号,这些动作可能表明多种动机——长期持有者可能为潜在的上涨做准备,机构可能在重新调整仓位,或者市场参与者对持续的抛压感到担忧。无论如何,如此大量的旧比特币重新激活通常预示着即将出现剧烈的价格波动。尽管在市场盘整期间此类动作并不罕见,但它们为当前的市场情绪更加增添了不确定性。
另外,分析师 DOM 在比特币的日线图上发现了一个前所未有的「十字星」形态(Doji),这种形态通常预示着市场的不确定性,类似于 2022 年 11 月 FTX 崩盘后的趋势。
DOM 表示:「在比特币 15 年的历史中,首次出现了连续三根‘极端十字星’蜡烛图,每根蜡烛的实体部分仅占整个蜡烛范围的不到 0.05%。这标志着市场极度犹豫不决,预示着即将出现大幅波动。」
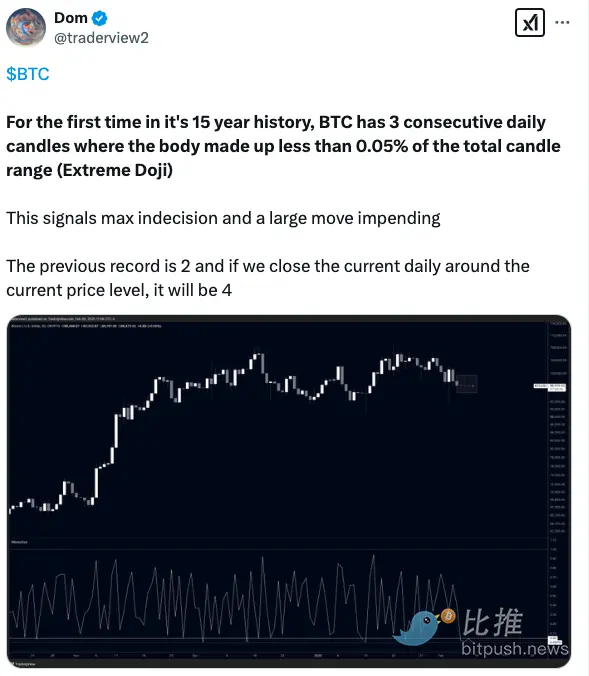
值得注意的是,2022 年 11 月比特币曾出现连续两根「极端十字星」蜡烛图,随后价格反弹了 620%。如果历史重演,比特币可能正处于另一轮爆炸性价格波动的边缘。
关键价格水平与技术分析
TradingView 数据显示,比特币当前价格在 97,600 美元附近徘徊,分析师 Sebastian 认为,要重新点燃看涨势头,比特币首先需要站稳 98,000 美元这一关键水平,这将为突破 10 万美元的心理关口奠定基础。一旦比特币成功突破并站稳 10 万美元大关,将确认多头动能的强势回归,并有望进一步上探更高的供应区间,开启新一轮上涨行情。
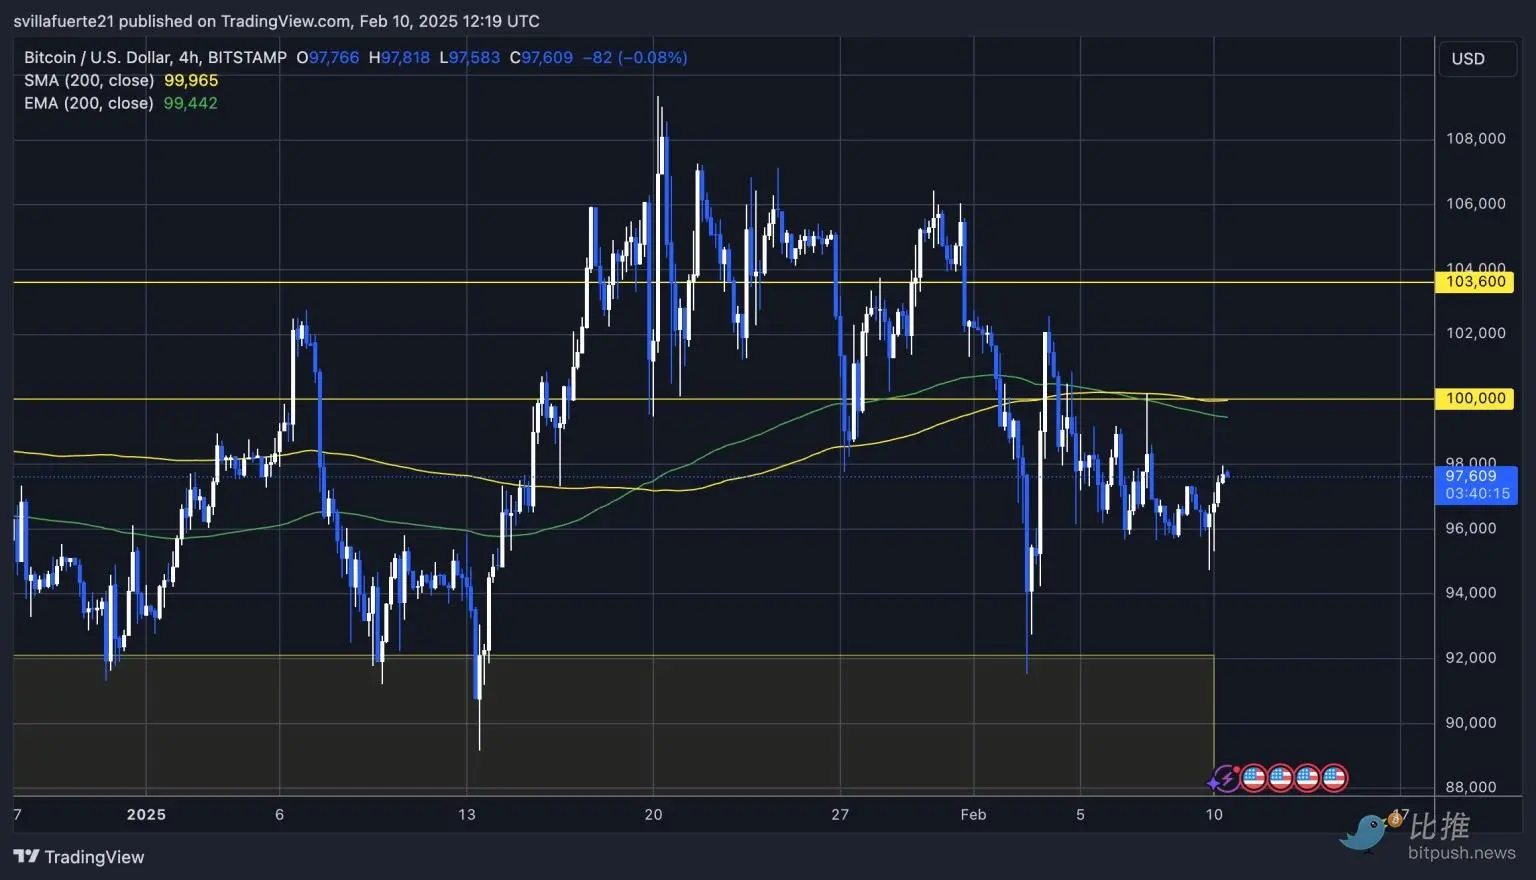
然而,当前 96,000 至 97,000 美元的需求区间必须守住,才能为潜在的上涨提供支撑。如果失守这一区间,可能引发更多抛压。在这种情况下,比特币可能会跌破 95,000 美元,进而下探至 90,000 美元附近的需求区间。这样的走势将严重打击市场情绪,并进一步强化看跌预期。
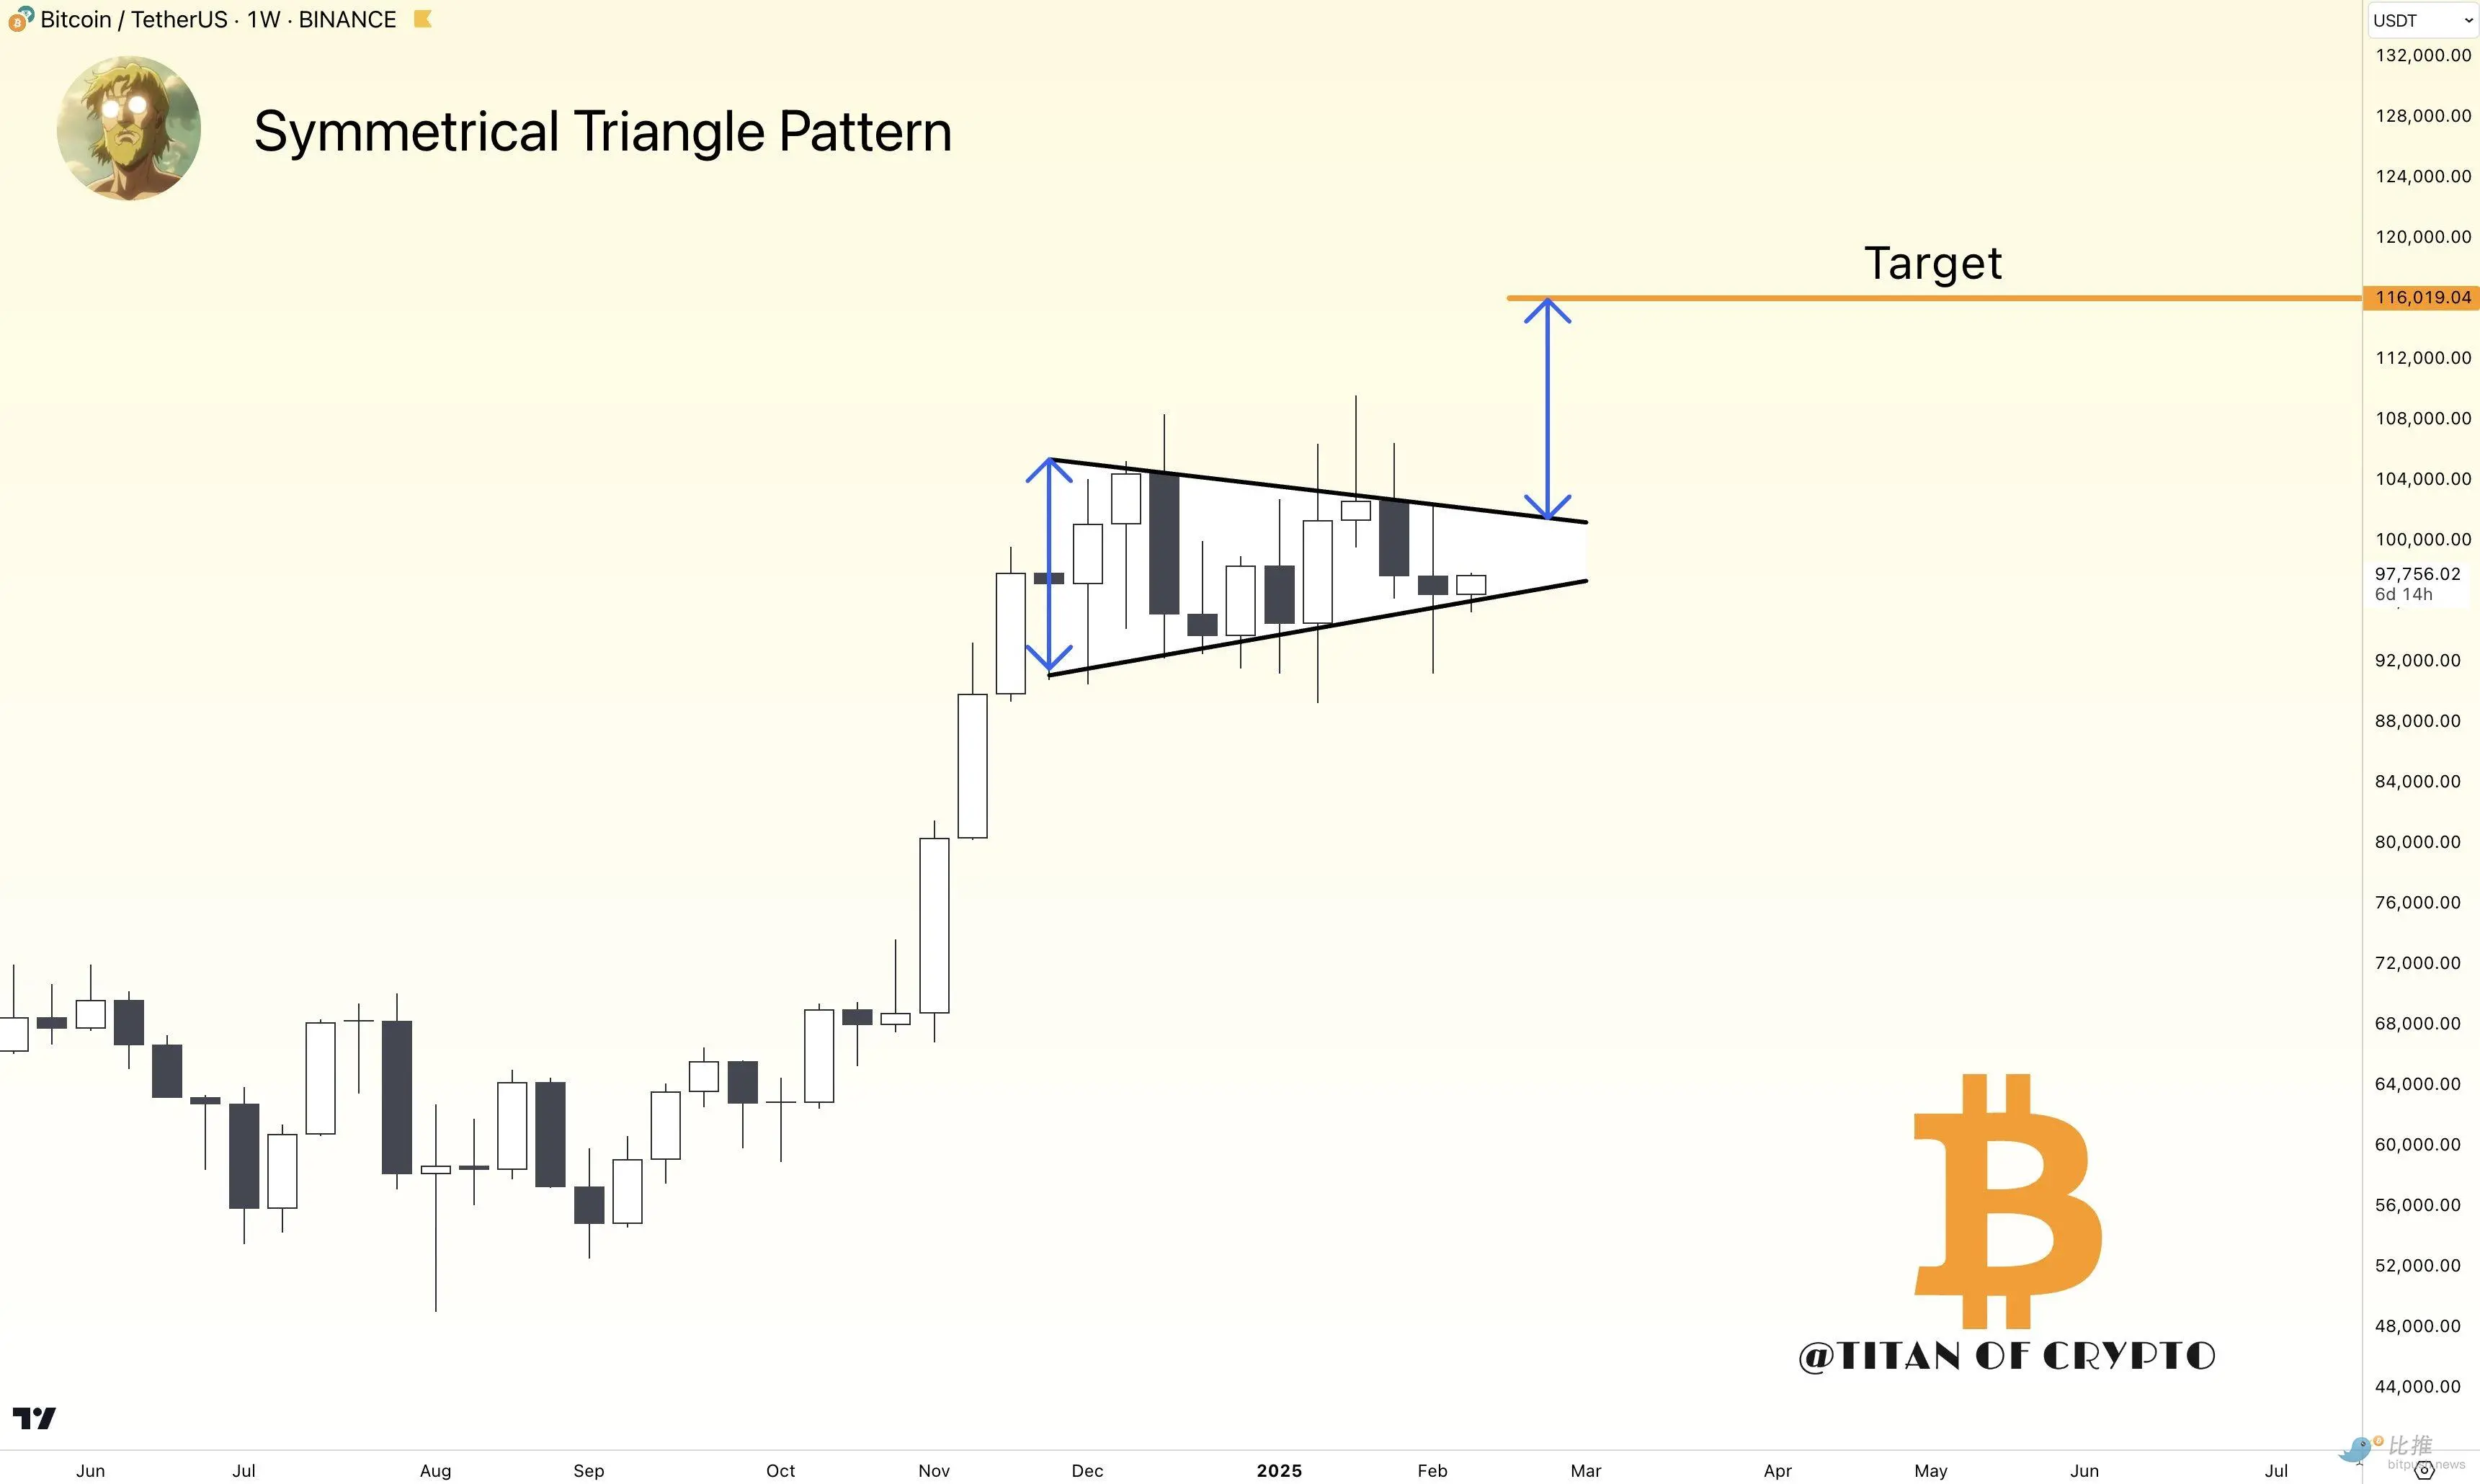
比特币近期还形成了一个对称三角形形态,这种技术形态通常预示着价格将出现大幅突破。
市场分析师 Titan of Crypto 指出,比特币价格有望突破三角形的上趋势线,并最终达到 116,000 美元的目标位。根据技术分析规则,上涨目标位的计算方式是将三角形上下趋势线之间的最大距离与潜在突破点相加,这一方法为比特币的上涨目标提供了理论依据。
走势展望
Grayscale 研究主管 Zach Pandl 预测,在特朗普政策利好的支持下,比特币可能在 2025 年第一季度创下历史新高。尽管如此,短期内 80,000 美元仍是许多分析师的热门目标位。投资研究公司 Bravo Research 指出,若价格回落至这一水平,将为交易者提供「逢低买入」的机会。
综上来看,比特币目前正处于一个关键的技术节点,多空双方的力量对比将决定短期内的市场走向。投资者需要密切关注 98,000 美元和 96,000 美元这两个关键水平的表现,任何一方突破都可能引发市场剧烈波动。
免责声明:本文章仅代表作者个人观点,不代表本平台的立场和观点。本文章仅供信息分享,不构成对任何人的任何投资建议。用户与作者之间的任何争议,与本平台无关。如网页中刊载的文章或图片涉及侵权,请提供相关的权利证明和身份证明发送邮件到support@aicoin.com,本平台相关工作人员将会进行核查。


