
今天新年初八开工大吉,鉴于前两天行情暴跌以太和山寨血崩有朋友担心牛市是否还在?公子直接在这里说结论:牛市结构暂时来说并没有打破,就是9万附近关键支撑,而且这轮牛市和以往的都不同,4年周期可能不适用,昨天公子也说调整的周期拉长了,后期11万若不能短时间去突破就不能排除去到7—8开头,除非跌回柱体下破7.4下方收不回才能确定牛市结束。
前天插针后快速反弹一万多点,还是有资金力度,短线就看二探测试,再看反弹高度,不能创新高就还要高位震荡甚至下跌。本来我们预计2月份会有一波不错的山寨季反弹行情,以太突破失败还闪崩暂时来说暴跌恐慌修复需要时间,但是Crypto在历年来上半年风险大于下半年,312、519等还有23年初在不断上涨的情况中间也出现不小回调,24年则在3月初后开启高位震荡下跌。
不管美股还是币圈我更希望有个“灰犀牛”(显而易见且高几率发生,却被视而不见的既存威胁」,最终将带来重大后果及影响,像08年金融危机早有预兆专家也有提醒,但没人愿意面对灰犀牛)才能更好的持仓。
大饼
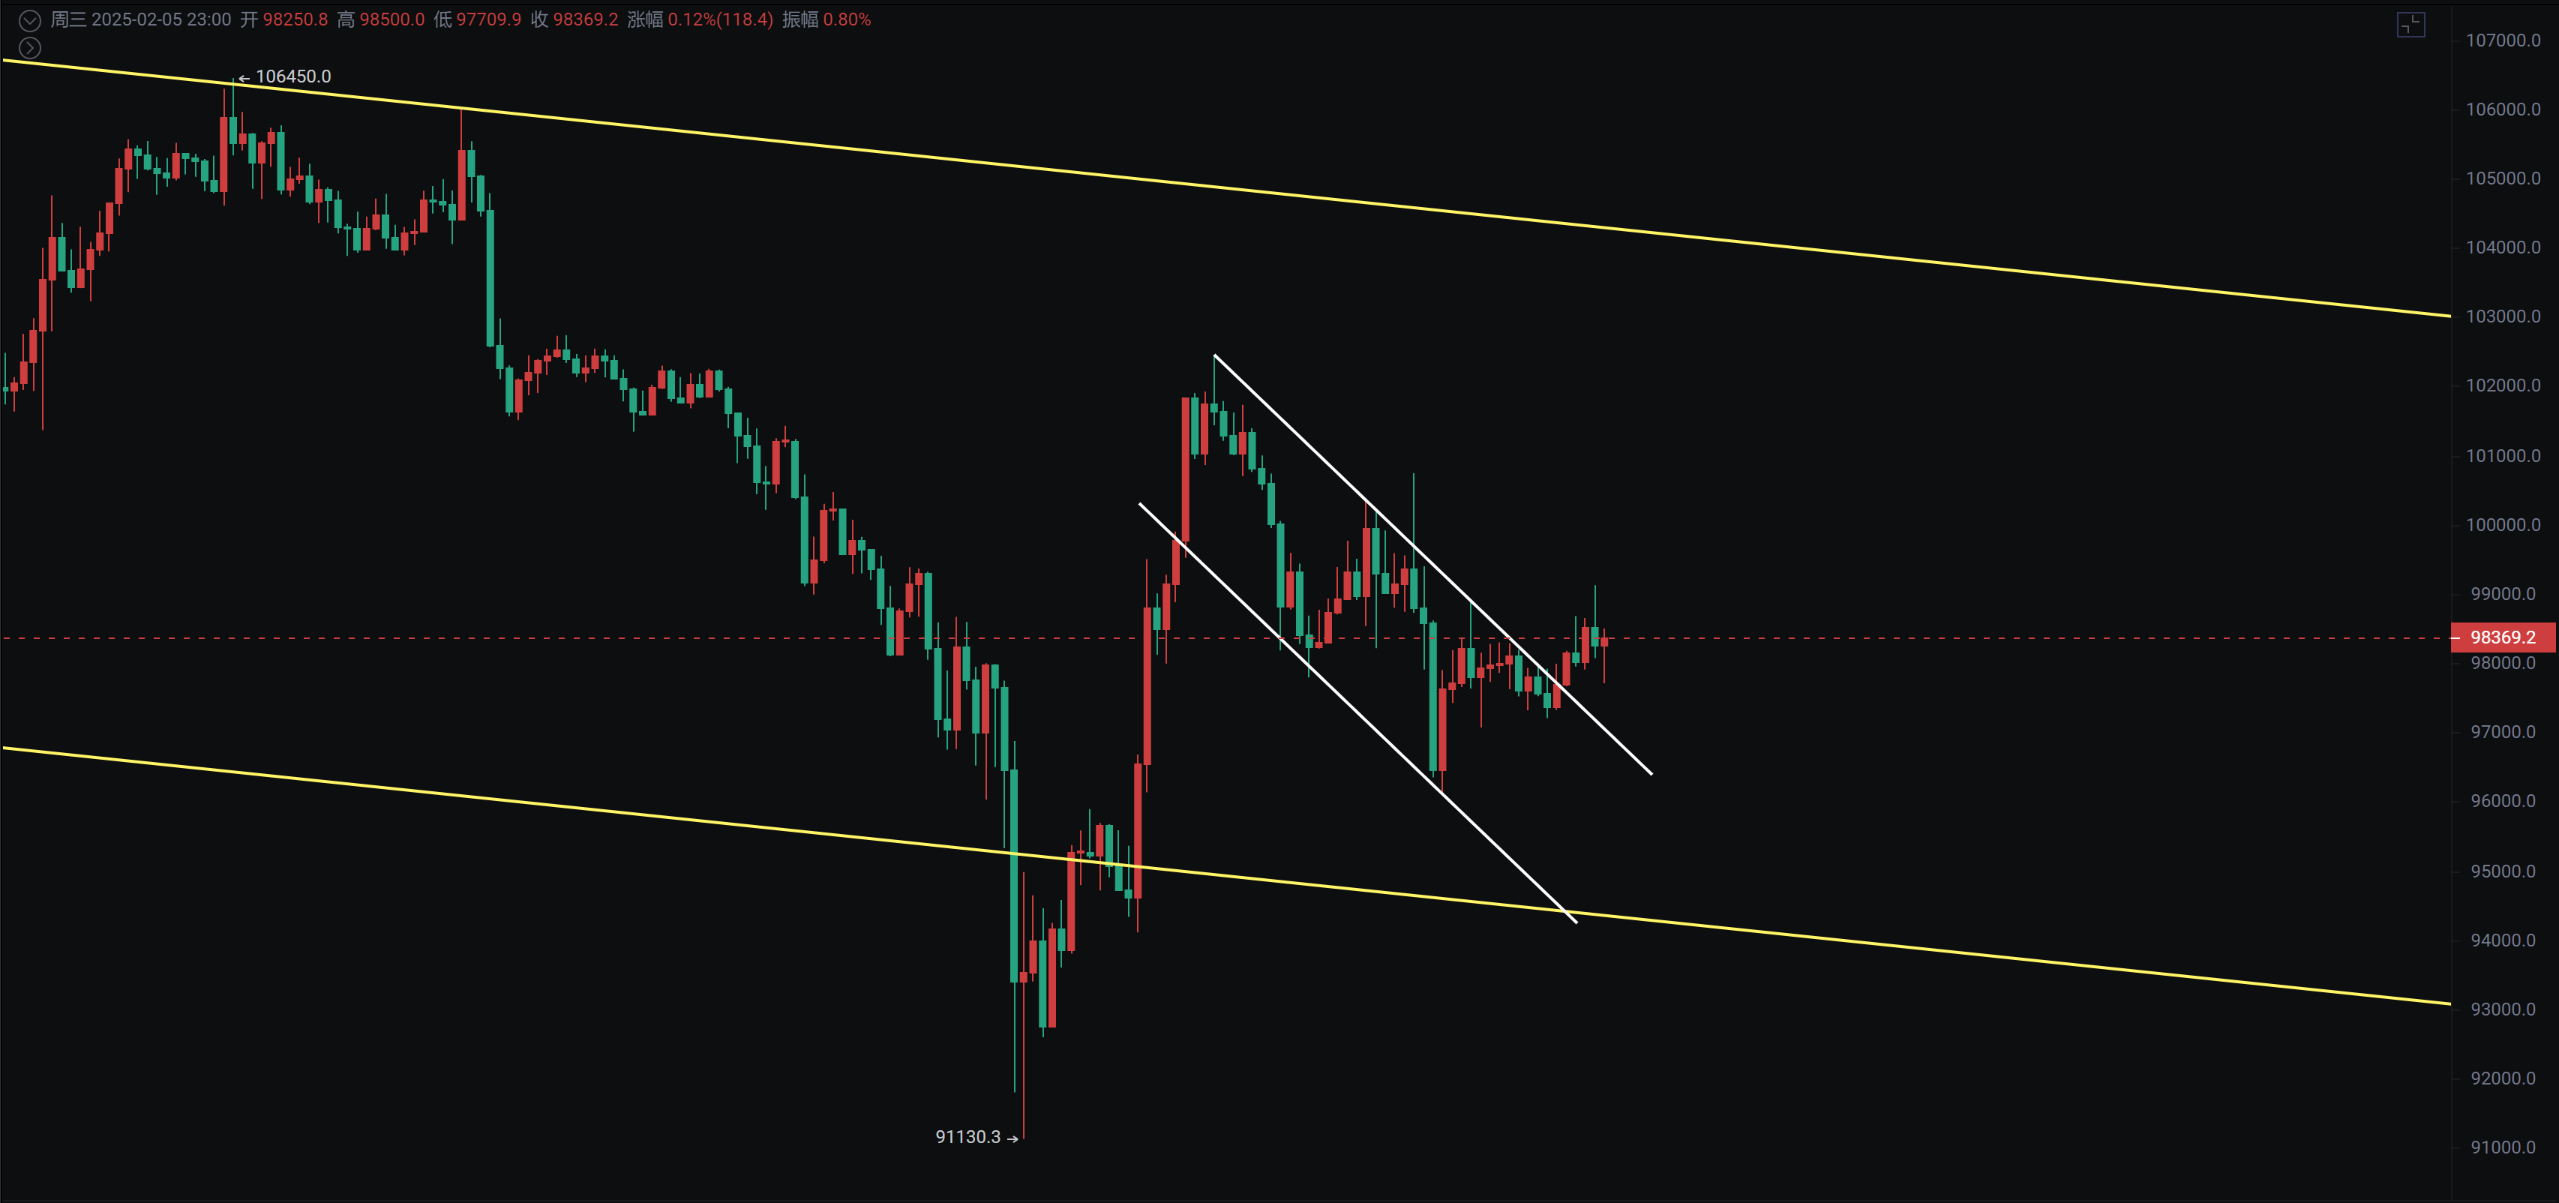
插针反弹至102456后就一直走回调,早间最低打到96100,截止发文反弹至98500,1小时下降通道突破技术面有底背离看反弹力度,4小时短线看能否出现二探接针的机会,留意能否出插针二探。
日线双阴夹阳全靠插针撑着,日线走的也是下降通道,后期反弹不能突破此通道还需谨慎走回调。
支撑: 压力:
以太
插针2125后续回调越接近插针底部反弹都是二探机会,周线此前我们说不能跌破2800,前天暴跌插针跌破,就看二探完柱体能否收回2800上方,如果迟迟收不回去以太行情不乐观。
从假突破到插针反弹未突破0.618,关注二探上车机会。
支撑: 压力:

如果你喜欢我的观点,请点赞评论分享,我们一起穿越牛熊!!!
文章具有时效性,仅供参考实时更新
专注k线技术研究,共赢全球投资机会公众号:交易公子扶苏

免责声明:本文章仅代表作者个人观点,不代表本平台的立场和观点。本文章仅供信息分享,不构成对任何人的任何投资建议。用户与作者之间的任何争议,与本平台无关。如网页中刊载的文章或图片涉及侵权,请提供相关的权利证明和身份证明发送邮件到support@aicoin.com,本平台相关工作人员将会进行核查。


