目录:
1.BTC技术分析;
2.加密市场全览,速读一周热门币种涨跌/板块资金流;
3.现货ETF资金流入流出情况;
4.场内BTC余额再创历史新低;
5.合约资金费率解读;
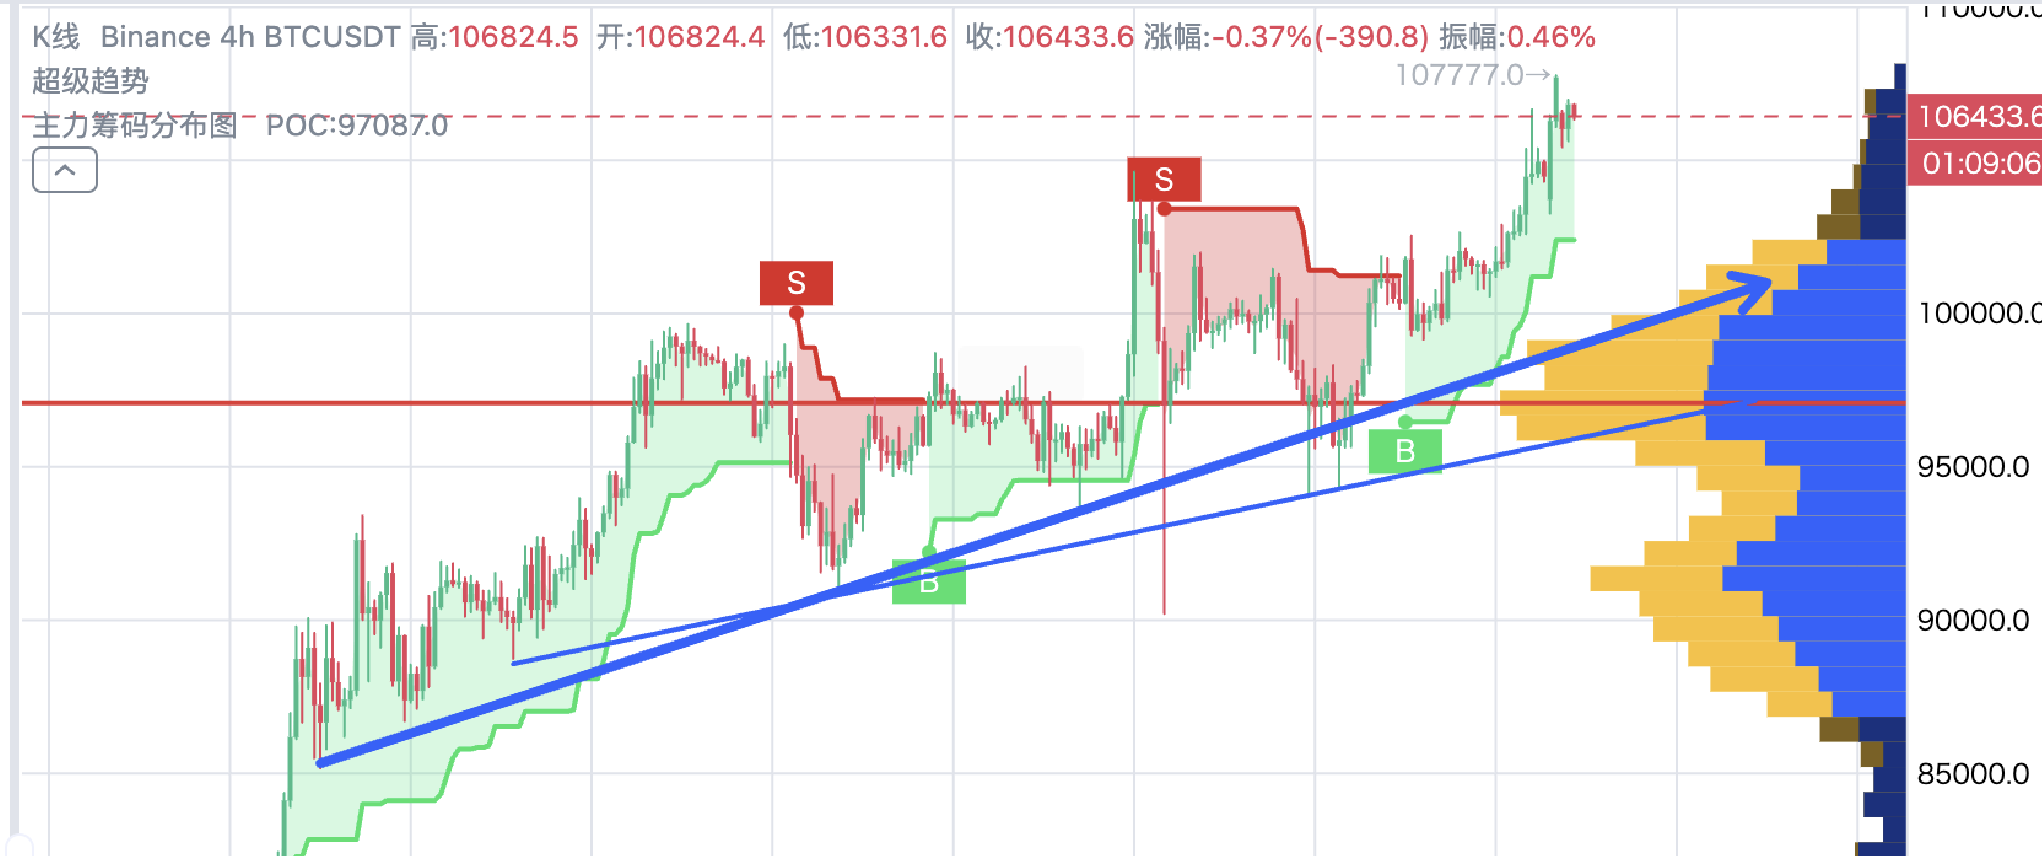
1.BTC技术分析:
BTC再创新高107777美元附近后回调,符合预判“整体将先涨后回调”,隔夜SEC文件披露MicroStrategy继续加仓比特币,上周购入15350个比特币,均100386美元,助推比特币价格与美股纳指一起继续创历史新高。
日线早间报收中阳留有小幅上影线,预计日内将先回调再反弹,整体思路不变:上方除近期高点已无可参考历史阻力位,下方支撑参考周末回调低点100610美元和99212美元附近,在没有跌破之前,行情大概率将延续多头走势。趋势指标4小时级别自12月12日以来显示多头信号,可考虑维持回调买入为主的右侧交易思路。
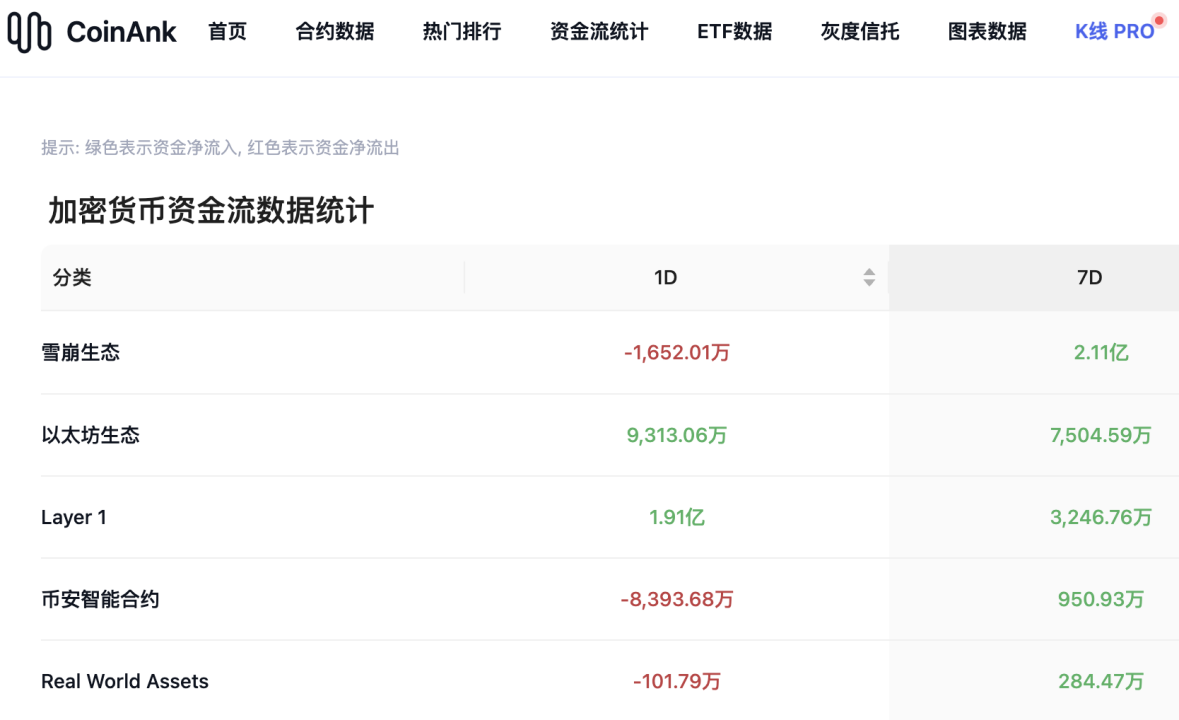
2.加密市场全览,速读一周热门币种涨跌/板块资金流
数据显示,过去一周,加密市场按概念板块划分,资金净流入规模较大集中在雪崩生态、以太坊生态、Layer 1、币安智能合约和Real World Assets即RWA等几大领域。而近一周的时间,也有不少币种都出现了较大的轮动上涨。选取市值前200如下,FARTCOIN、VIRTUAL、AAVE、ONDO、ENA和ENS等代币。
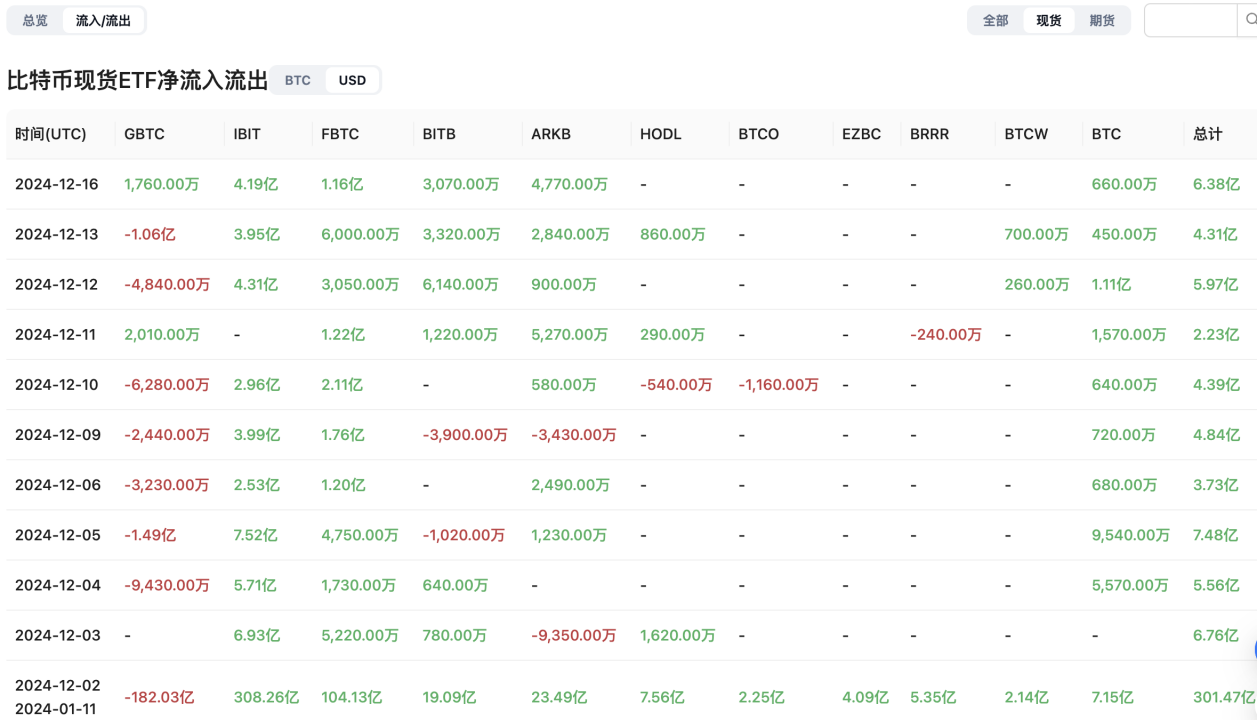
3.现货ETF资金流入流出情况。
数据显示,比特币现货ETF在过去一周内表现出强劲的资金流入趋势,单周净流入额高达21.7亿美元,并且这一趋势已经连续五个交易日得以维持。这表明投资者对比特币现货ETF的兴趣和信心正在逐步增强。其中,贝莱德的IBIT ETF以15.1亿美元的净流入额位居榜首,其历史总净流入更是达到了358.8亿美元,进一步巩固了其在该领域的领先地位。富达(Fidelity)的FBTC ETF也表现不俗,单周净流入5.98亿美元,历史总净流入达到了123.1亿美元。这些数据都显示出,大型金融机构旗下的比特币现货ETF正在吸引越来越多的投资者关注。
然而,与比特币现货ETF的强劲表现形成鲜明对比的是,Grayscale的GBTC ETF上周却出现了2.21亿美元的净流出,其历史累计净流出额已经达到了210.5亿美元。这可能表明,部分投资者对灰度GBTC的看法开始发生变化,或者他们正在寻找其他更具吸引力的投资机会。
与此同时,比特币现货ETF的总资产净值已经达到了1149.69亿美元,占比特币总市值的5.71%,历史累计净流入也达到了356.02亿美元。此外,美国上市的ETF管理的总资产已经首次突破10万亿美元的门槛,其中400亿美元已经投入到了加密货币领域。这一趋势表明,加密货币作为新兴的投资领域,正在逐步得到主流金融机构和投资者的认可和接纳。
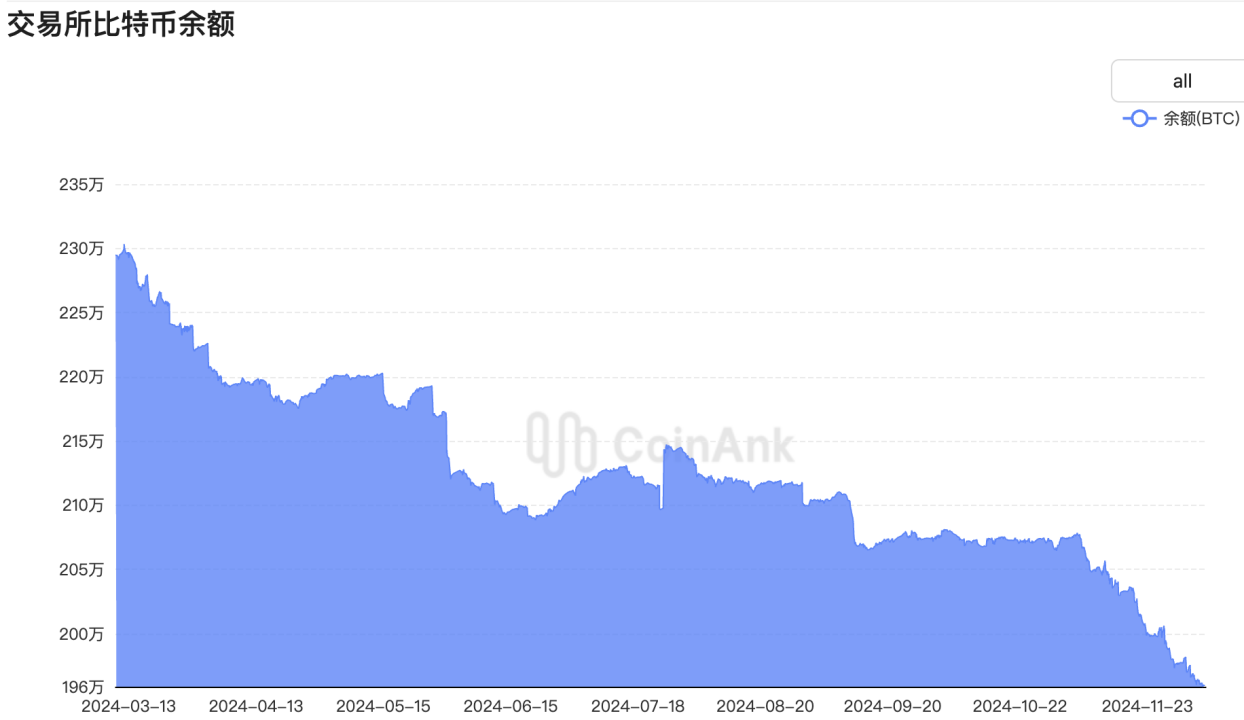
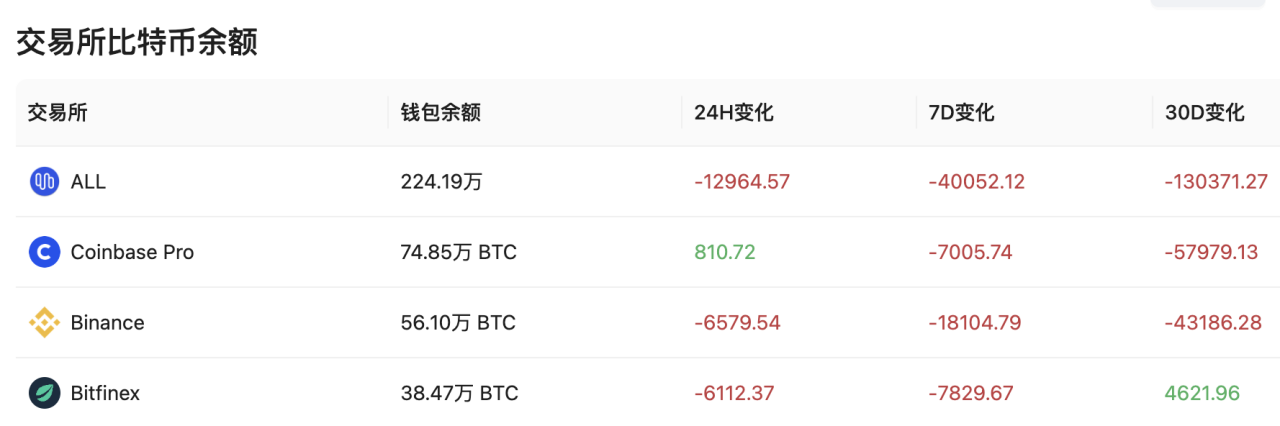
4. 场内BTC余额再创历史新低。
数据显示,在过去7日,中心化交易所(CEX)累计净流出37,708.42枚BTC,显示出市场对比特币的持有趋势。其中,CoinbasePro、Binance和Bitfinex分别流出16,090.22枚、11,724.57枚和2,527.98枚BTC,位居前三。这一现象可能反映了大型投资者对比特币的长期持有信心,以及可能的市场趋势变化。
我们认为,这种大规模的BTC流出可能与几个因素有关。随着币价上涨,流出量增加可能表明投资者对比特币的长期价值持有信心,选择将资产转移到个人钱包中,减少在交易所的持有量,以降低潜在的安全风险和提高资金控制力。此外,随着加密货币市场的成熟,越来越多的投资者可能倾向于长期持有而非短期交易,这也可能导致了流出量的增加。这些数据提供了对市场情绪和投资者行为的重要视角,对理解比特币市场的动态具有参考价值。
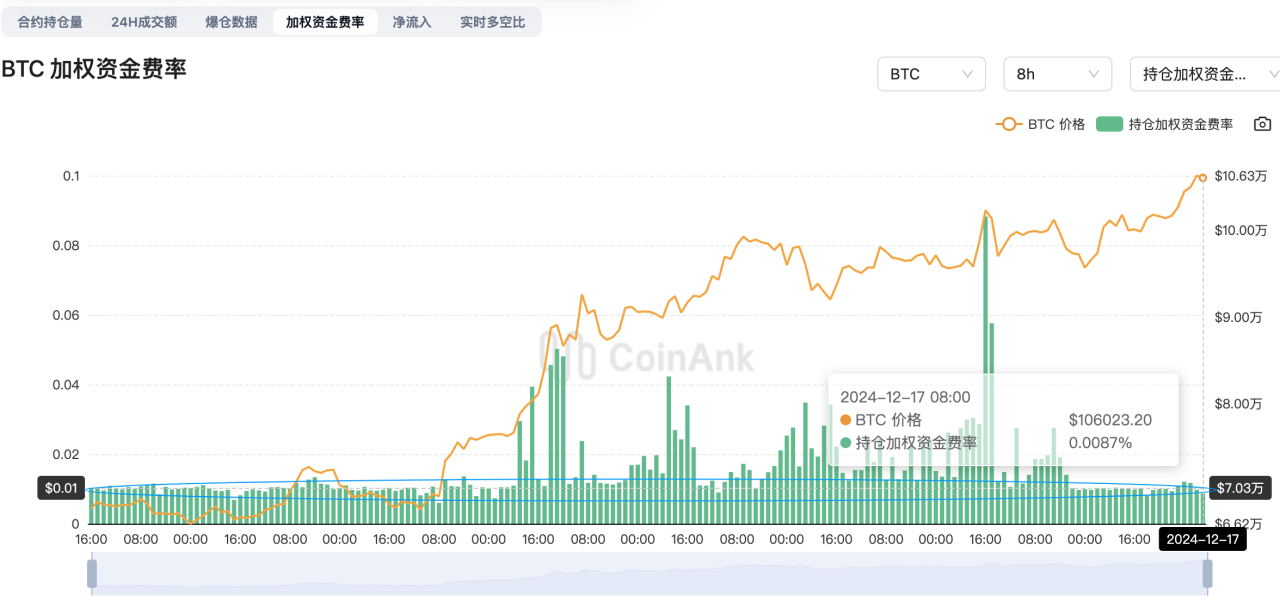
5.BTC合约资金费率和多空比解读。
根据合约数据,BTC合约资金费率维持在万1左右的正值水平。
实际资金费率万1左右对比历史是正常且健康的水平,比如前段时间行情大幅上涨市场进入fomo状态,可能会失衡到万3-万5甚至万10及以上。而近期这轮BTC再创历史新高,资金费率其实是相对健康的状态,自12月10日以来,近期一直维持在万1左右的这个水平,昨日行情大幅上涨也没有出现极端偏离的情况。
我们常看到资讯或有人说资金费率套利年化收益10.95%,其实就是以万1来计算,日均万3,年均就是万分之1095即10.95%。
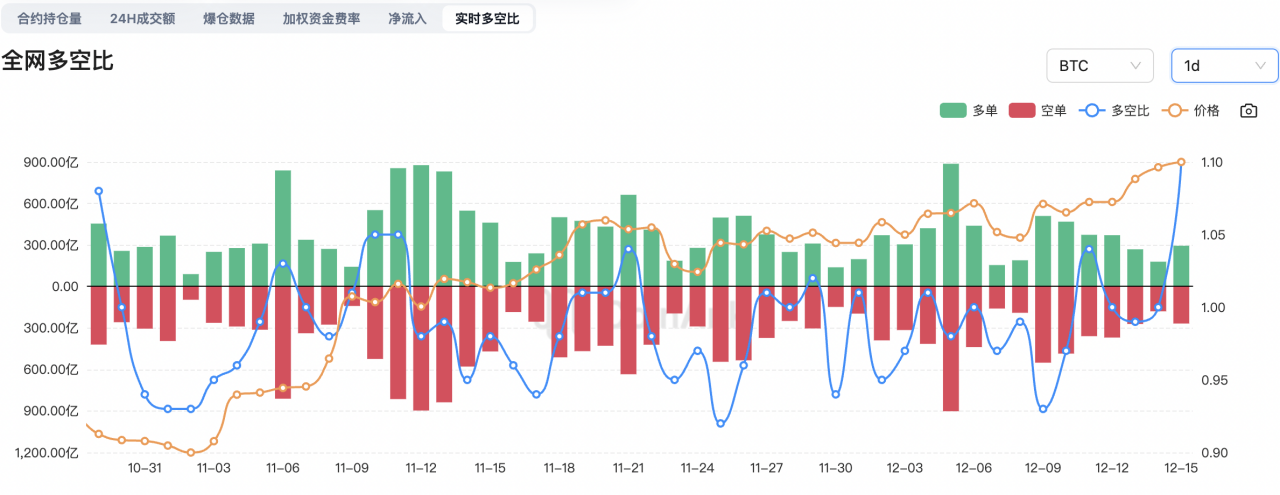
而关于多空比,以上周五为例实际上当天币安多空比大致在0.88-0.94区间,多空人数上空头稍微占优,也就是全体用户多头人数比空头人数稍微少一点,在阶段上涨行情中这是相对正常的水平,因为有短期投机者会在上涨过程中多头获利减持、短期空头介入,就会产生这种略低于1的数据水平;但当天大户持仓多空比维持在1.73-1.85,也就是在主力持仓上,多头占63-65%的相对优势。实际后来行情也是震荡走高,并在本周周一创历史新高。
我们经常看到的资金费率正值万1左右,其实已经说明多头持仓占比相较较多了。但有些朋友喜欢把多空比和资金费率两个数据完全放在了对立面。实际上,大家经常看到的多空人数比低于1,就是空头人数相对多些,但持仓上还是多头占优,因为资金费率的设计逻辑就是市场看涨才会是正值,也是根据多空持仓的规模进行多空互付,多头持仓占比多时就是多付空状态。
而多空人数比上空头人数稍微占优意义并不如持仓层面的数据会影响行情本身,因为撮合和流动性机制问题,在阶段上涨行情中,多空人数比略低于1这是相对正常的水平,因为有短期投机者会在上涨过程中多头获利减持、短期空头介入,就会产生这种略低于1的数据水平。重要的数据还是应该看整体持仓的多空比以及大户持仓的多空比数据。
如果表述多空比时还是应该加上人数多空比或者持仓/及主动买卖量比(整体多空持仓比)/大户持仓多空比,才不会产生歧义,因为两者数值经常会出现相反的情况,但实际理解不同类型的多空比,就能理解相应的含义了。
免责声明:本文章仅代表作者个人观点,不代表本平台的立场和观点。本文章仅供信息分享,不构成对任何人的任何投资建议。用户与作者之间的任何争议,与本平台无关。如网页中刊载的文章或图片涉及侵权,请提供相关的权利证明和身份证明发送邮件到support@aicoin.com,本平台相关工作人员将会进行核查。


