Original author: Murphy (X: @Murphychen888)

Detailed analysis of ETH on-chain data, here it is as you requested:
Why is ETH performing so poorly this round?
Is there still hope for ETH?
Under what circumstances can ETH rebound?
In response to the questions that friends are concerned about, I will attempt to provide some comparisons and analyses from the perspective of on-chain data, hoping to offer some reference. I will analyze and discuss this in the following 5 chapters, and if you can patiently read through, I believe you will gain something.
(1/5)
Perhaps because ETH has been performing "too well" recently, more and more friends have been messaging me to analyze some on-chain data for ETH. For instance, during my lecture in Shenzhen, the most frequent question from friends afterward was also about ETH.
Sigh… What has ETH done to make so many friends so concerned? When asked how ETH can get out of its slump, I usually jokingly reply, "Unless Vitalik follows Satoshi Nakamoto and the Ethereum Foundation disbands" … Of course, jokes aside, to analyze the reasons specifically, we still need to start from effective data.
I believe many of you have seen various bloggers analyze ETH's narrative ability, ecological construction, technical competition, and other aspects in this round, so I won't reiterate that here. In fact, whether the price is good or not ultimately comes down to whether "money" is good or not; as long as it can attract and chase funds, there is nothing that a big bullish line cannot solve.
Therefore, how to determine whether ETH is being noticed by funds is particularly important. I have two measurement standards: the first is "the flow ratio of ETH on exchanges", and the second is "on-chain comprehensive activity";
The so-called exchange flow refers to the total amount transferred in and out of exchanges daily, where inflows can be seen as supply and outflows as potential demand. When the "flow" increases, it at least indicates one thing: ETH is starting to attract more funds!
Especially, we can use #BTC as a reference, as the status of Bitcoin in the market is irreplaceable. By observing the flow ratio of ETH relative to BTC, we can clearly see the changes in fund preferences.
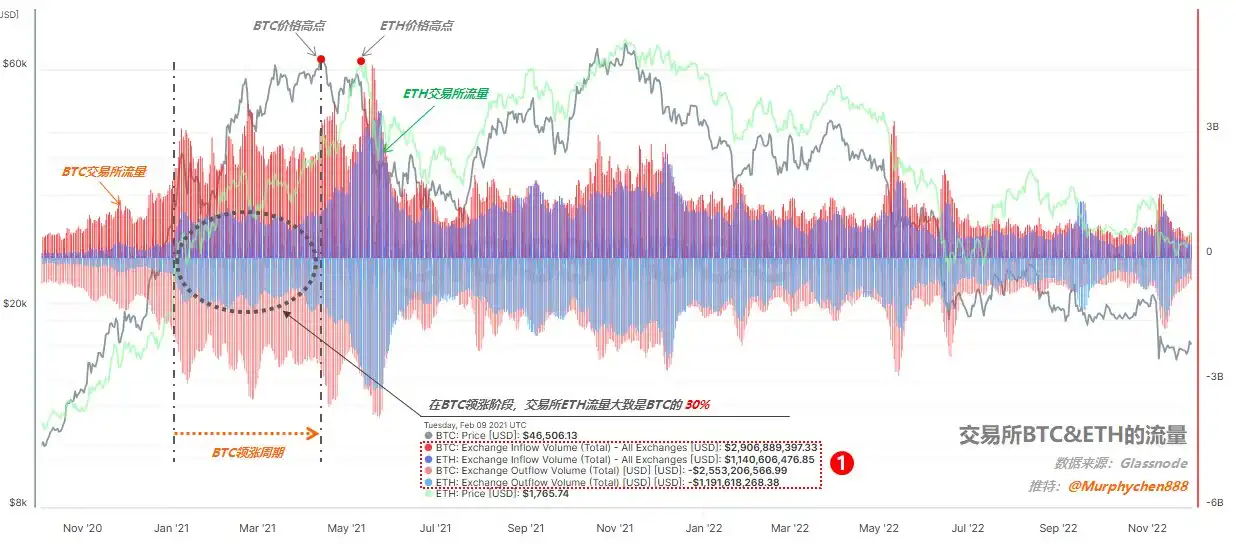
The following chart (Chart 1) shows the flow data of BTC & ETH on exchanges. To facilitate the subsequent explanation, we need to understand some key elements in the chart:
The gray and light green curves in the chart represent the prices of BTC and ETH, respectively;
The red wavy line represents the inflow and flow of BTC on exchanges; the blue wavy line represents the flow of ETH on exchanges;
The area above the zero axis represents inflow, while the area below the zero axis represents outflow.
(Chart 1)
First, let's look at the flow performance of ETH in the last cycle:
From January to April 2021 was the leading period for BTC, and the attention of market funds was almost entirely on BTC; for example, on February 9 (see the annotation in Chart 1), BTC had an inflow of $2.9 billion and an outflow of $2.5 billion; ETH had an inflow of $1.14 billion and an outflow of $1.19 billion; at this time, the exchange flow of ETH was roughly about 30% of BTC.
(Chart 2)
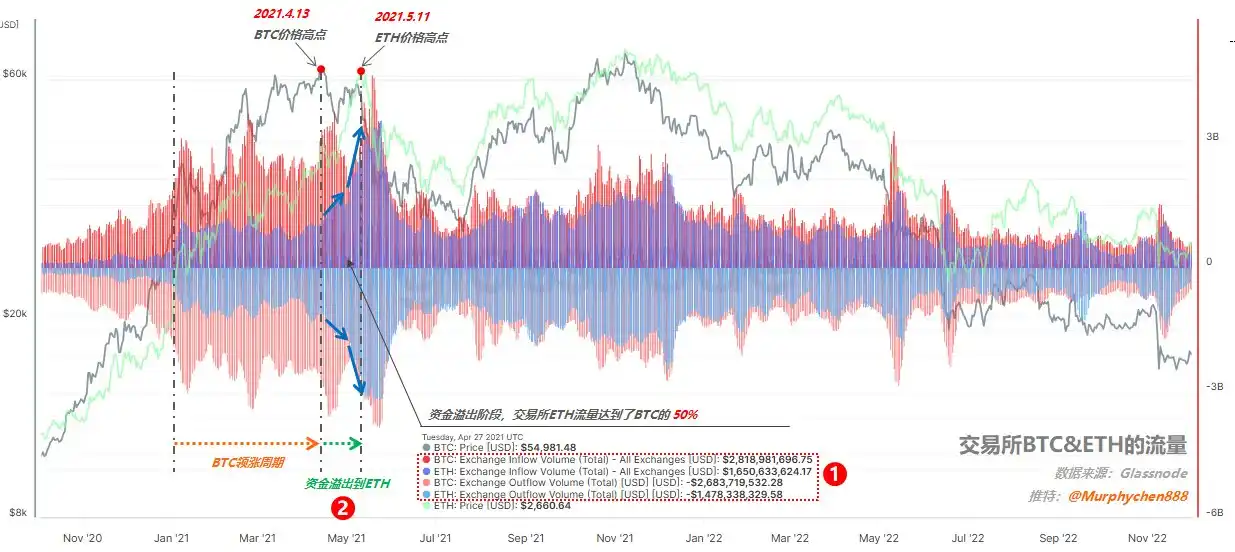
By April to May 2021, BTC began to pull back, while ETH started to rebound. The essence behind this is the shift in fund preferences. For example, on April 27 (see the annotation in Chart 2), BTC had an inflow of $2.8 billion and an outflow of $2.7 billion; while ETH had an inflow of $1.6 billion and an outflow of $1.5 billion; the flow ratio reached 50% of BTC.
Please note the causal relationship here: it is not that BTC's pullback necessarily caused ETH to rebound; rather, it was the push from funds that made ETH perform strongly at this time. The amplification of the flow ratio precisely indicates the overflow effect of funds (see the annotation in Chart 2), with more and more focus shifting to ETH. Therefore, ETH also reached its historical high of $4,172 one month after BTC hit its price peak.
(Chart 3)
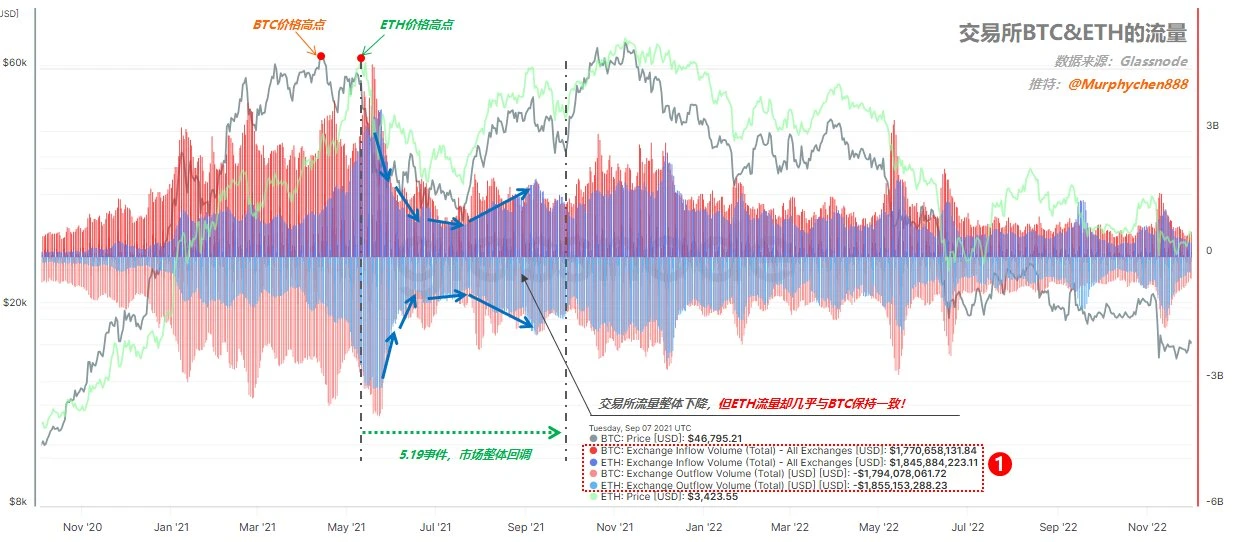
After May 2021, due to the occurrence of the Black Swan event on May 19, panic sentiment collapsed the overall market, and the exchange flow of both BTC and ETH began to shrink simultaneously, with prices falling in tandem. At this time, we can observe that even though the overall flow was decreasing, the flow ratio of ETH on exchanges did not decrease but instead increased, almost maintaining parity with BTC, rising from the previous 50% to 100%! (see the annotation in Chart 3)
This indicates that market funds did not flow back to BTC due to panic sentiment; instead, they became even more optimistic about ETH. This is also the fundamental reason why, in the second peak area of the last bull market, ETH could even outperform BTC in terms of both height and stability.
(2/5)
I can summarize that in the last cycle, when BTC started, the flow ratio of ETH was 30%; when it first peaked and fell back, the flow ratio of ETH was 50%; and at the second peak, it had already reached 100%.
Now let's look at the flow performance of ETH in this round:
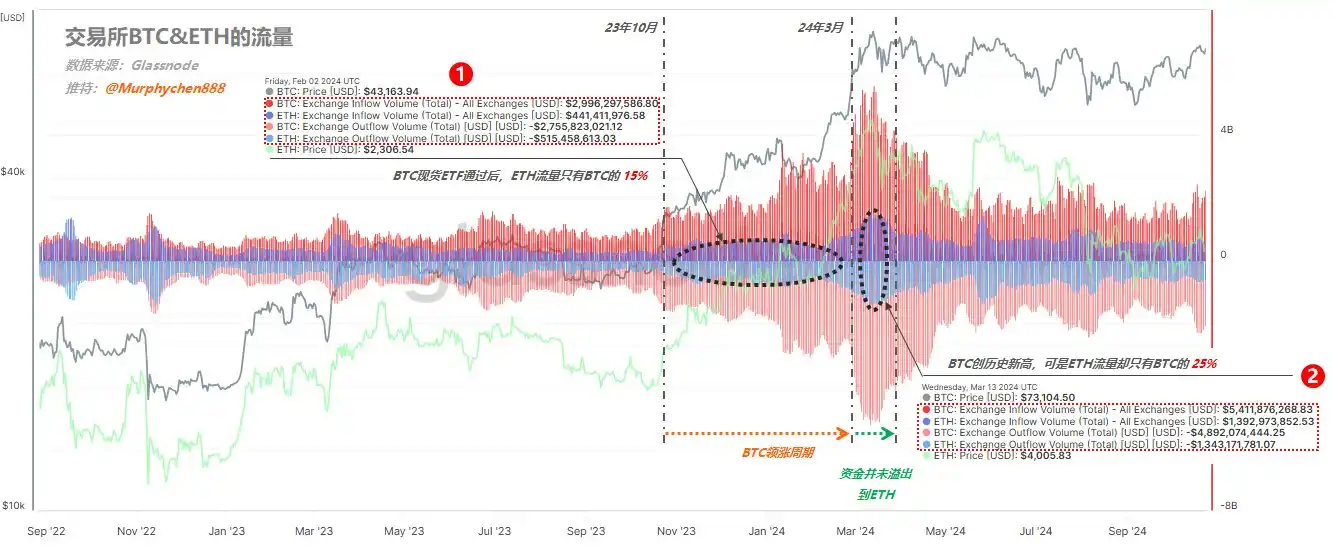
From October 2023 to March 2024, it was the leading period for BTC in this cycle. Due to the speculative hype surrounding BlackRock's application for a spot ETF, market funds were similarly more focused on BTC;
(Chart 4)
On February 2 (see the annotation in Chart 4), BTC had an inflow of $3 billion and an outflow of $2.8 billion; while ETH had an inflow of only $440 million and an outflow of $510 million; at this time, the exchange flow of ETH was roughly only about 15% of BTC, which can be described as pitifully low.
Entering March, when BTC's price broke through the historical high of $73,000, although ETH also rose in tandem, the exchange flow of ETH compared to BTC did not show significant improvement. For instance, on March 13 (see the annotation in Chart 4), BTC had an inflow of $5.4 billion and an outflow of $4.9 billion; ETH had an inflow of $1.4 billion and an outflow of $1.3 billion; even at the most FOMO moment in the market, the exchange flow of ETH was only about 25% of BTC.
Comparing this to the previous cycle on April 27, 2021 (see Chart 2 in 1/5), ETH's price was also around $2,600 (similar to now), but at that time, the flow ratio of ETH had already reached 50% of BTC, which later led to the historical high of $4,172.
It is clear that in this cycle, after BTC broke through its historical high, funds did not overflow from BTC to ETH as they did in the previous cycle.
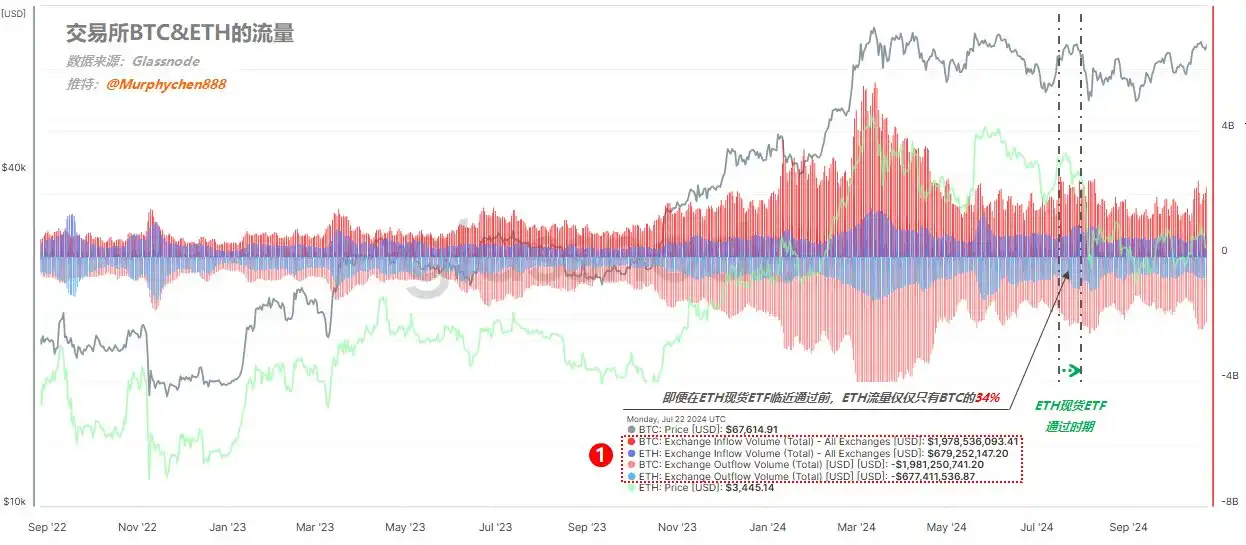
(Chart 5)
Even by July, around the time the ETH spot ETF was approved (as shown in Chart 5), the exchange flow of ETH was only about 34% of BTC, which is far from the reasonable level of 50% in the previous cycle, not to mention that in the second peak area, the flow of ETH even reached 100% of BTC (see Chart 3 in 1/5).
It was also because of this data that I made the decision to exchange my ETH for BTC on the day the ETH spot ETF was approved.
(Chart 6)
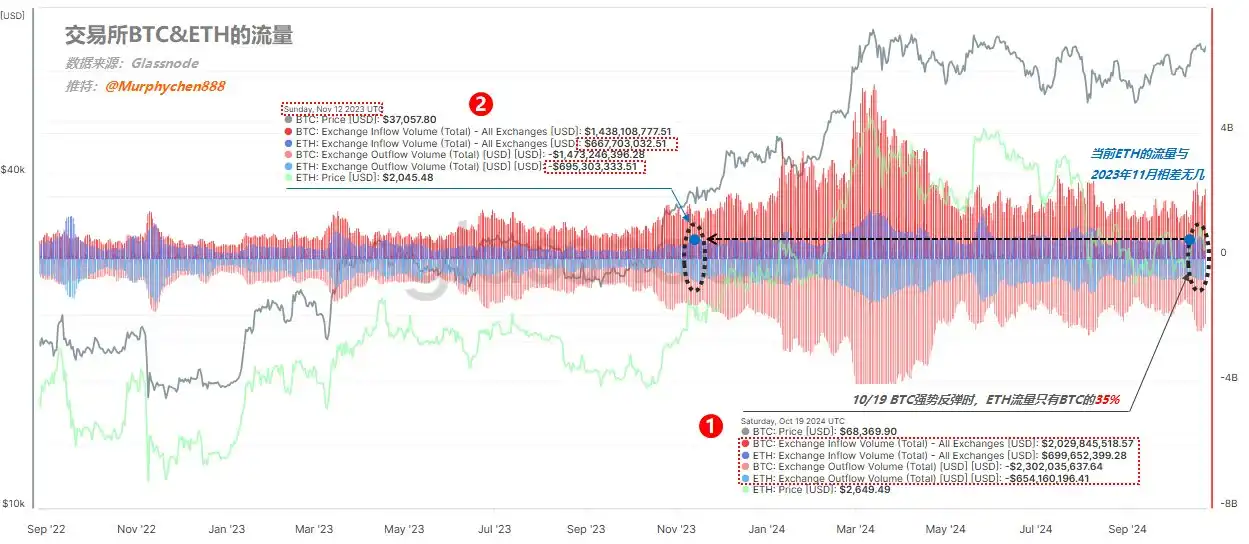
On October 19, when BTC rebounded to $68,000, BTC had an inflow of $2 billion and an outflow of $2.3 billion; ETH had an inflow of $700 million and an outflow of $650 million; the exchange flow of ETH also maintained around 35% of BTC (see the annotation in Chart 6).
The inflow of $700 million and outflow of $650 million is roughly equivalent to the scale at the beginning of the bull market in November 2023 (see the annotation in Chart 6).
It can be seen that from the beginning of this cycle to now, the attention of funds towards ETH has remained lukewarm; it is not that there is none, but compared to the previous cycle, it has fallen too short. Even with the approval of the spot ETF, which is an epic positive, it has not been able to spark greater interest from funds. Why is that?
(3/5)
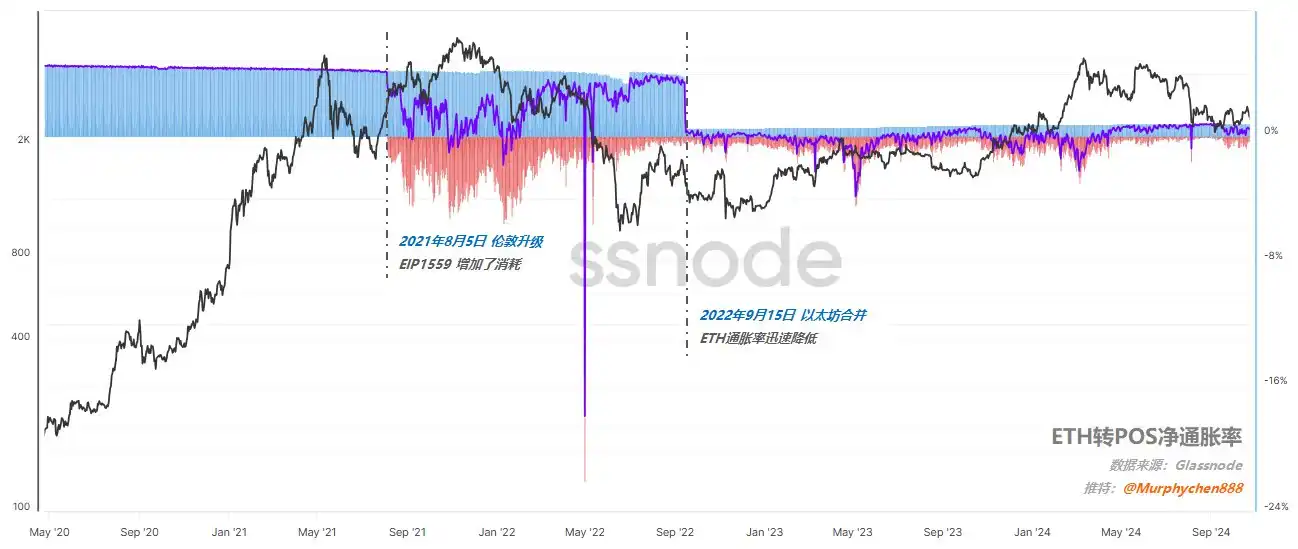
We all know that in 2021, ETH's consensus mechanism transitioned from PoW (Proof of Work) to PoS (Proof of Stake), a process known as "The Merge." This entire process includes two important stages (as shown in Chart 7):
(Chart 7)
On August 5, 2021, the London upgrade primarily introduced the EIP-1559 proposal, which changed the transaction fee structure and reduced the inflation of ETH supply, preparing for the merge.
On September 15, 2022, the ETH mainnet completed its transition from PoW to PoS, after which block generation is handled by validators rather than miners.
There are mixed opinions on whether the transition from PoW to PoS is good or bad. For example, Ni Da @PhyrexNi expressed his support for the transition to PoS yesterday, arguing that it would be unwise for ETH to remain in the PoW track and compete with BTC for electricity. Brother Jason @jasonchen wrote an extremely insightful article on October 24, analyzing the "internal and external factors" behind Ethereum's current stalemate by referencing the business cases of Alibaba and Pinduoduo.
However, regardless of how we discuss "good and bad," it seems that funds have already voted with their feet.
(Chart 8)
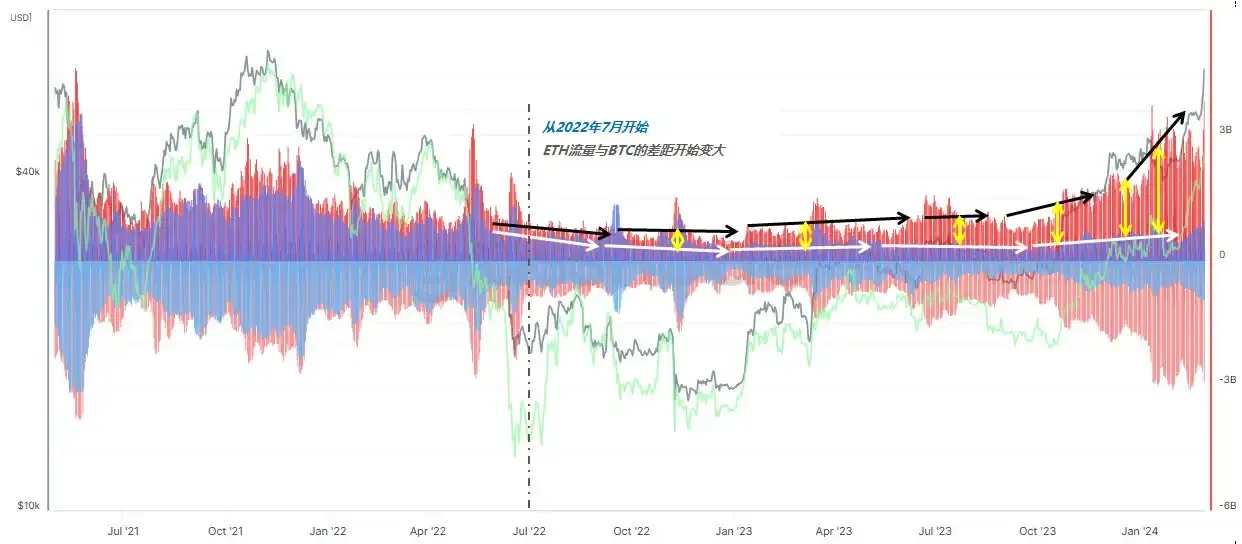
As shown in Chart 8, starting from July 2022, the gap between the flow ratio of ETH on exchanges and BTC began to gradually widen, a trend that has continued to this day. This indicates that from this time onward, funds began to gradually exit ETH. Coincidentally, this starting point coincides with the eve of Ethereum's mainnet completing the transition from PoW to PoS.
The reason for the preference of funds returning to BTC should not be the ETF, as shortly after the approval of BTC's ETF, ETH's ETF was also approved. But was it caused by the transition from PoW to PoS? I'm not sure.
Nevertheless, one thing is certain: if Ethereum continues to maintain the status quo (both internally and externally), then even with the support of the ETF, it will be difficult to achieve a flow ratio of over 50% compared to BTC on exchanges. This is because the market has already rehearsed this after the FOMO sentiment in March of this year.
(4/5)
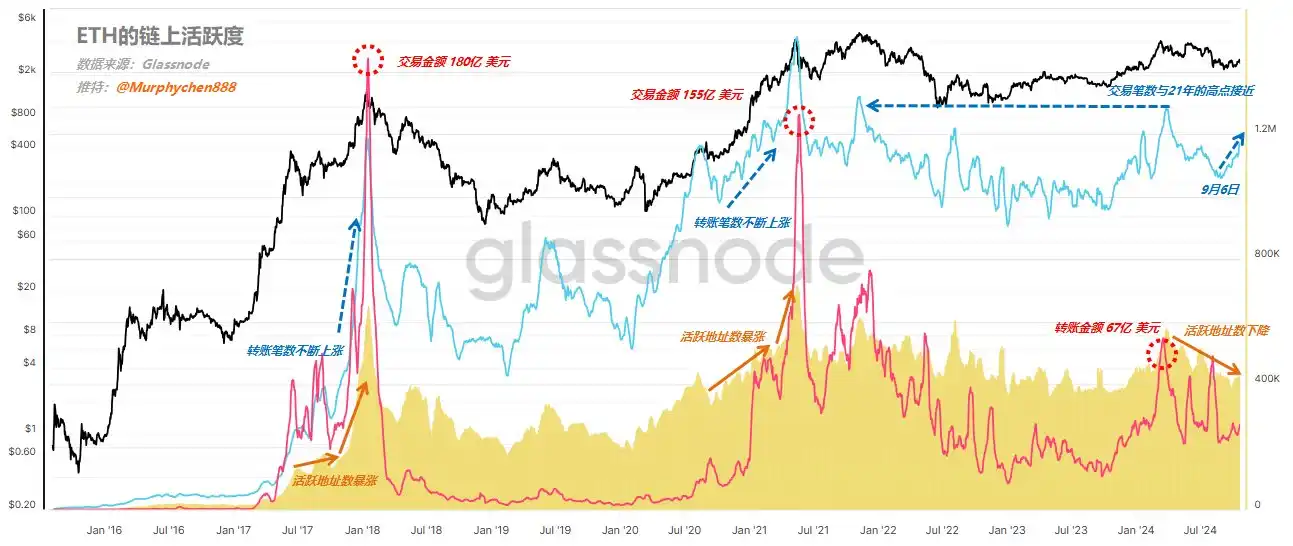
Having looked at the exchange flow data, let's now examine the on-chain activity data for ETH. I define the integration of three dimensions of data as on-chain activity, including:
Active addresses (yellow waveform in the chart)
Number of transactions (blue line in the chart)
Transaction amount, measured in USD (red line in the chart)
(Chart 9)
From Chart 9, we can clearly see that during the strong price periods of ETH in 2017-2018 and 2020-2021, there was a surge in the number of active addresses, while the number of initiated transactions and the transaction amounts in USD were also rising simultaneously. Notably, during January 2018 and May 2021, the on-chain transaction amounts for ETH reached record highs of $18 billion and $15.5 billion, respectively.
In this current cycle, since March, the number of active addresses for ETH has been continuously declining. Although the number of transactions did reach levels close to the highs of 2021 in March, the transaction amount was only $6.7 billion, indicating that compared to the previous cycle, ETH has also lost the participation of "large funds" in on-chain transactions. The scale of transactions has not even reached half of the 2021 peak, with the number of transactions being close but involving relatively smaller amounts of funds.
(5/5)
Under What Circumstances Can ETH Rebound?
The data I have listed above are objective facts, but that does not mean I completely view ETH pessimistically. Personally, I believe that now is not a good time to enter ETH.
Whether ETH can rebound after BTC starts depends on the degree of fund preference, which can be corroborated by on-chain comprehensive activity data, allowing for a fairly accurate judgment.
When is it more appropriate to enter? My principles are:
The flow ratio of ETH on exchanges to BTC should reach 50% or above (currently at 35%).
Perhaps by the time it reaches 50%, ETH's price will have already risen, but it certainly won't be at its highest. For me, I need to confirm the trend first before executing a strategy.
The number of active addresses on-chain reflects the prosperity of the ETH ecosystem to some extent, indicating a need for a sustained upward trend.
The number of transactions and transaction amounts should increase simultaneously, especially the transaction amount, which is an important indicator of whether large funds are participating.
免责声明:本文章仅代表作者个人观点,不代表本平台的立场和观点。本文章仅供信息分享,不构成对任何人的任何投资建议。用户与作者之间的任何争议,与本平台无关。如网页中刊载的文章或图片涉及侵权,请提供相关的权利证明和身份证明发送邮件到support@aicoin.com,本平台相关工作人员将会进行核查。


