
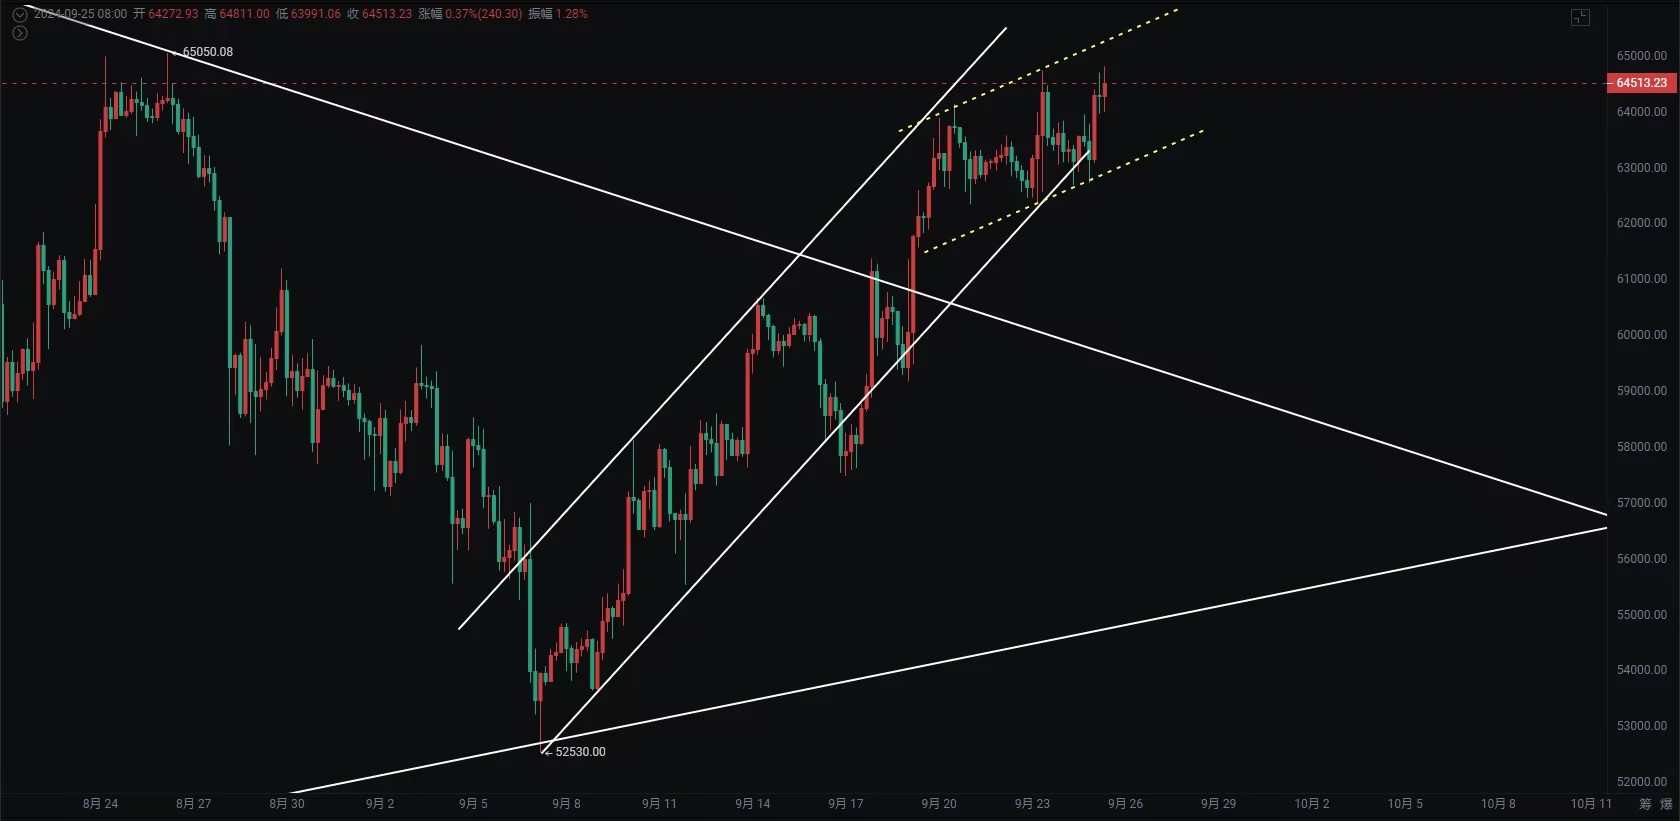
BTC has been under pressure below 65,000 for a week. On the daily K-line, it still looks strong, mainly oscillating narrowly between 62,350 and 64,745, and the probability of breaking through 65,000 has increased. The 4-hour chart has been in an upward channel, and after touching above 64,000, it has once again moved out of the upward channel. The possibility of breaking through the 65,000 neckline is relatively high, with the opportunity to touch near the upper edge of the daily ascending flag at around 68,000, and a short-term pullback is still worth expecting.
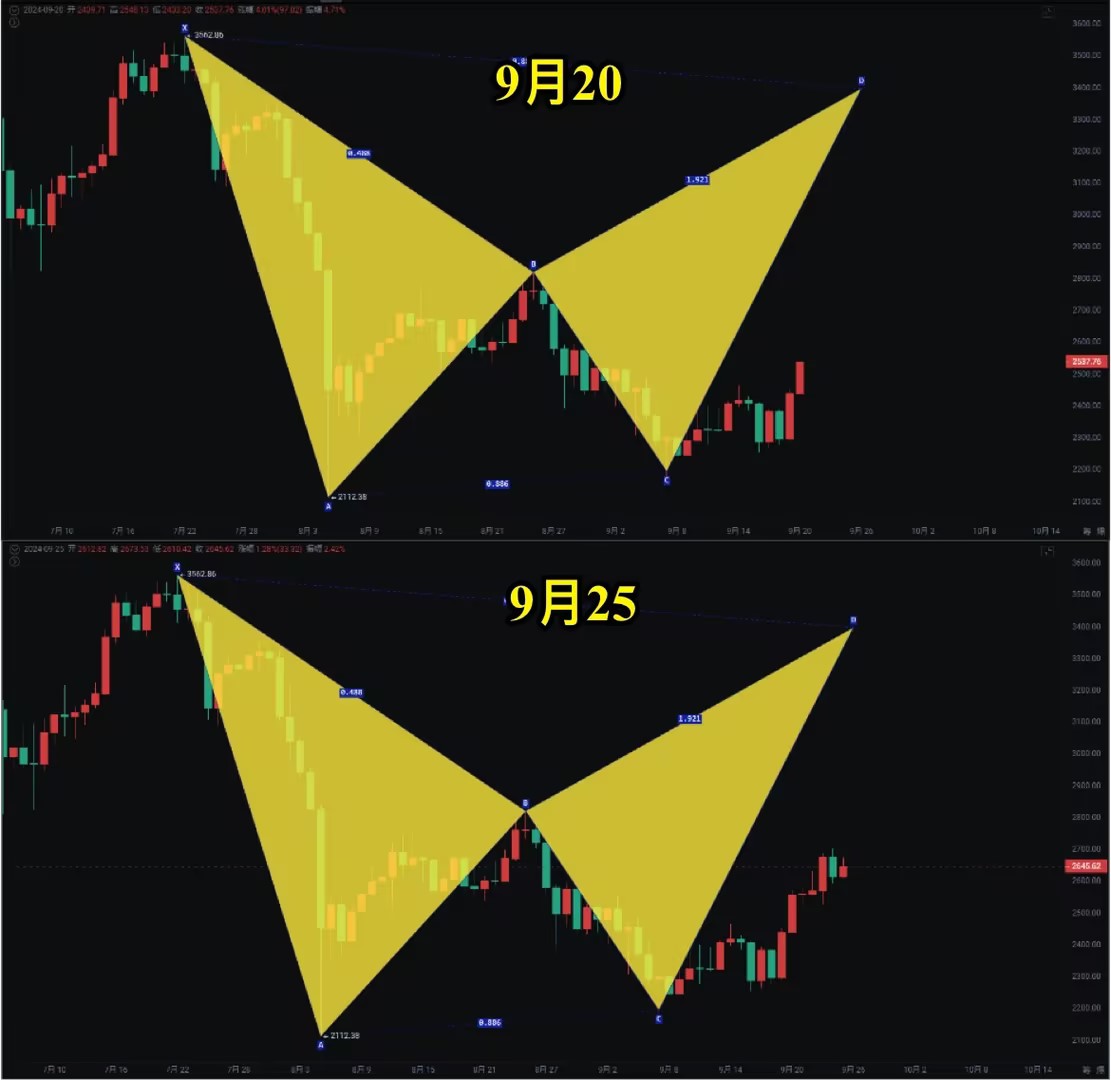
ETH is maintaining above 2,600, with the next resistance at 2,800 very close. Pay attention to this line as the boundary between bullish and bearish for Ethereum. Keep an eye on the ETH/BTC exchange rate for the opportunity of a rebound after retracing to 0.04.
Bitcoin On the weekly chart, it has risen above the BOLL midline, and there is a probability of the MACD histogram shortening and the fast and slow lines crossing above the zero line. We have been paying attention to the divergence of the 3-day MACD relatively early. On the daily chart, this is another wave of bottom-divergence MACD histogram flipping above the zero line, bringing an internal rebound of the flag shape. In fact, this kind of market, difficult to say difficult, not difficult to say not difficult, is just an internal high and low absorption of the daily ascending flag shape, and many people have been shaken out of their positions.
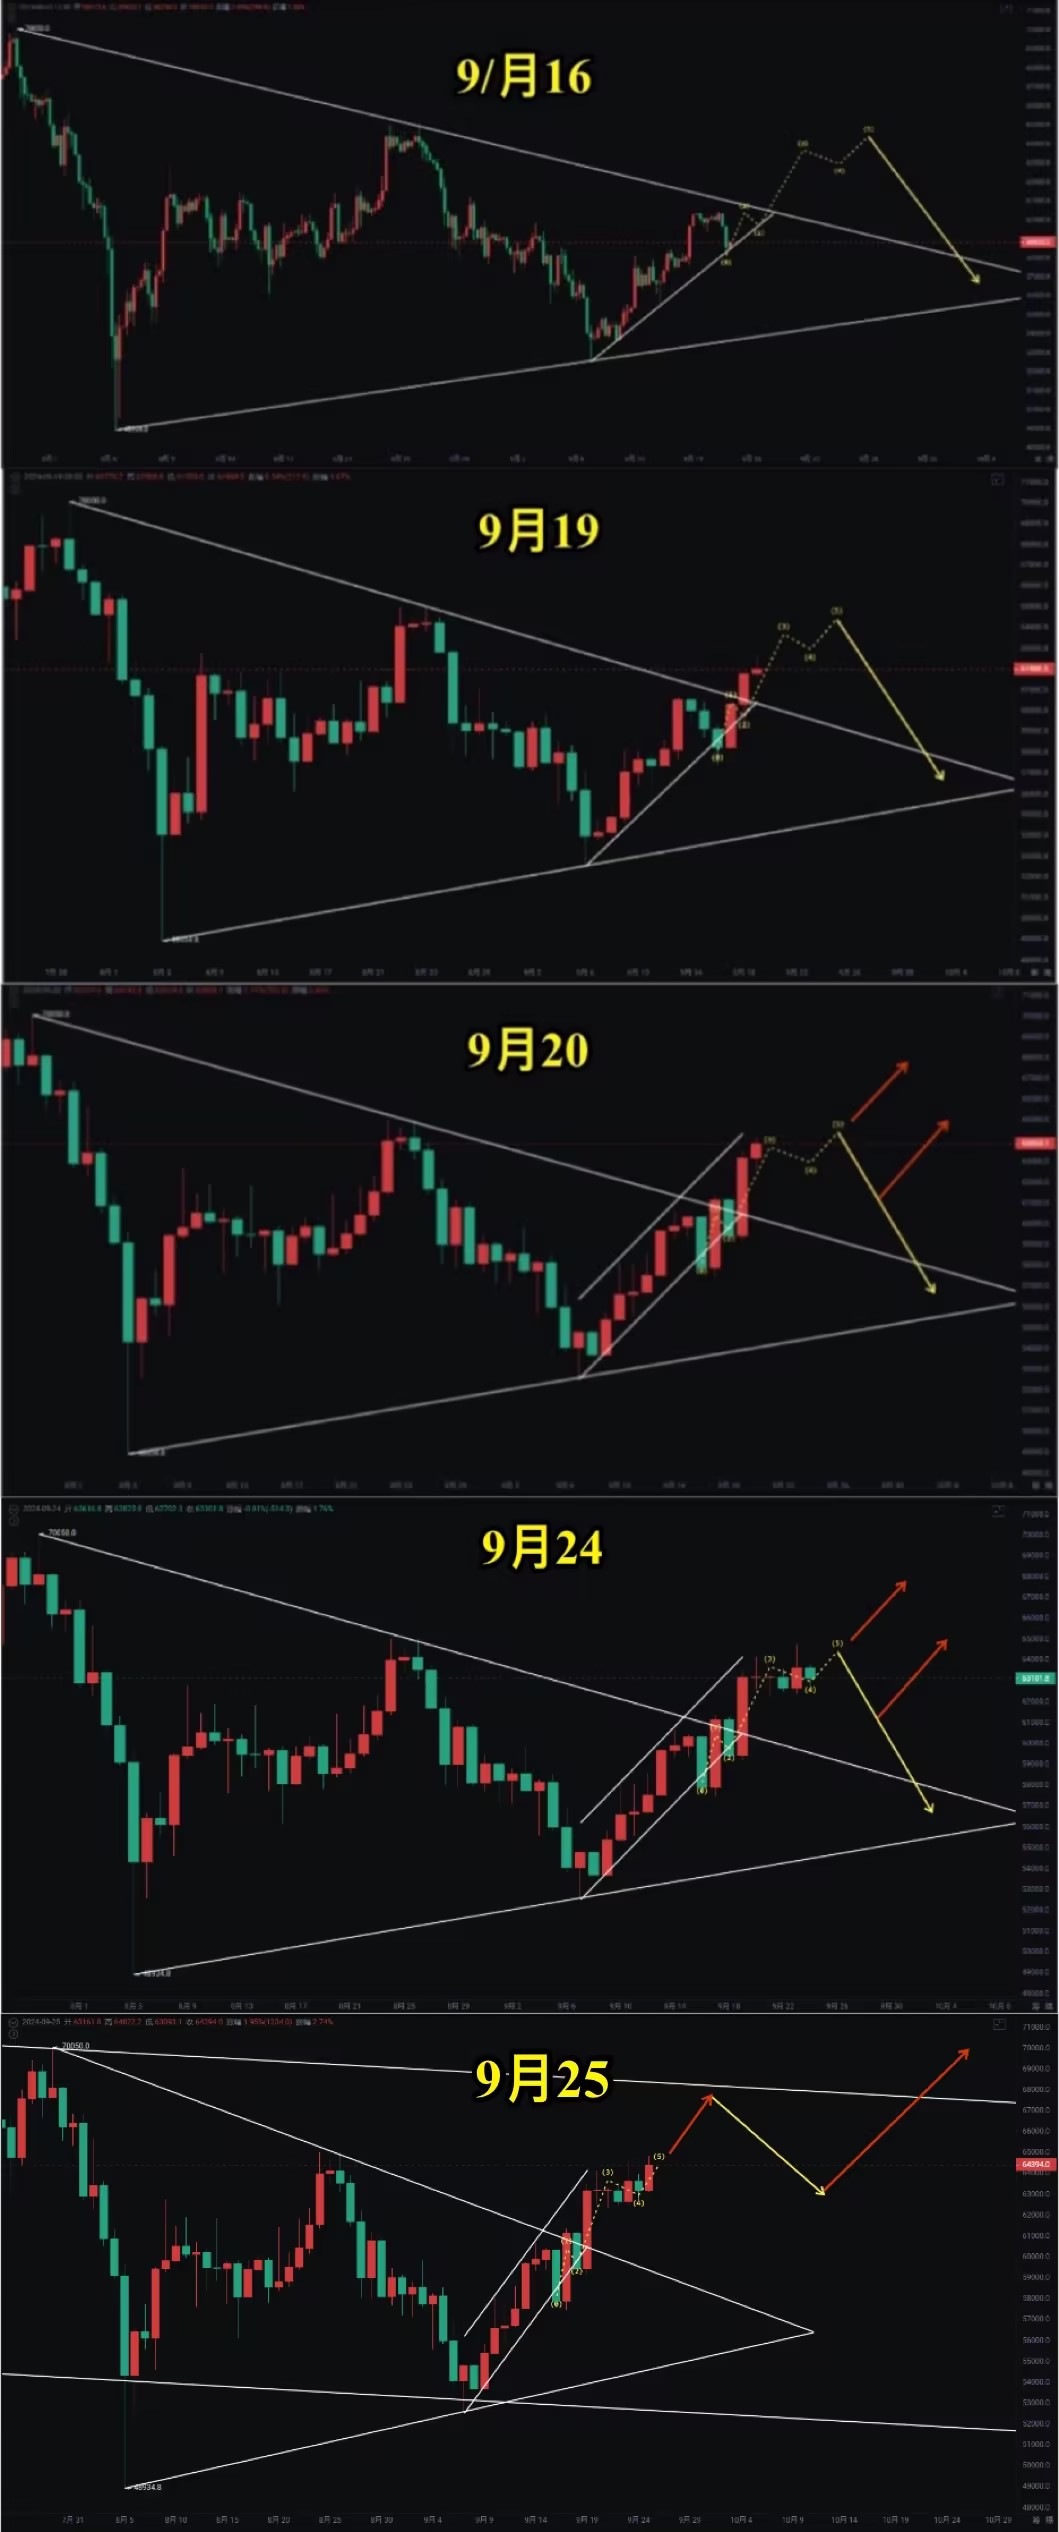
Maintaining an upward channel on the 4-hour chart, after reaching 64,000, it has formed a smaller upward channel, and there is a high chance of breaking through 65,000. Unlike the previous wave that touched 65,000 and then fell, it is using high-level oscillation to digest the pressure. Patiently wait for the pressure near the upper edge of the flag, and it is not recommended to chase the small-level pullback in the short term.
Support: Resistance:
Ethereum Ethereum is also rebounding on the weekly chart, with RSI already breaking through the KDJ crossover. The rebound pressure is seen at 2,820 and 3,080, and the bat pattern is looking towards 3,300 to 3,400, expecting a market during the National Day holiday in October.
As long as it maintains above 2,500 to 2,560 on the daily chart, it is still bullish, and on the 4-hour chart, it is still above the irregular upward channel. The upward rebound pressure is increasing, and it is also not recommended to chase directly, but to enter on small-level pullbacks.
Support: Resistance:
If you like my views, please like, comment, and share. Let's go through the bull and bear markets together!!!
The article is time-sensitive and is for reference only, with real-time updates.
Focus on K-line technical research, and win-win global investment opportunities. WeChat public account: 交易公子扶苏

免责声明:本文章仅代表作者个人观点,不代表本平台的立场和观点。本文章仅供信息分享,不构成对任何人的任何投资建议。用户与作者之间的任何争议,与本平台无关。如网页中刊载的文章或图片涉及侵权,请提供相关的权利证明和身份证明发送邮件到support@aicoin.com,本平台相关工作人员将会进行核查。


