Trading philosophy: Look at the trend in the long term, find the position in the short term;
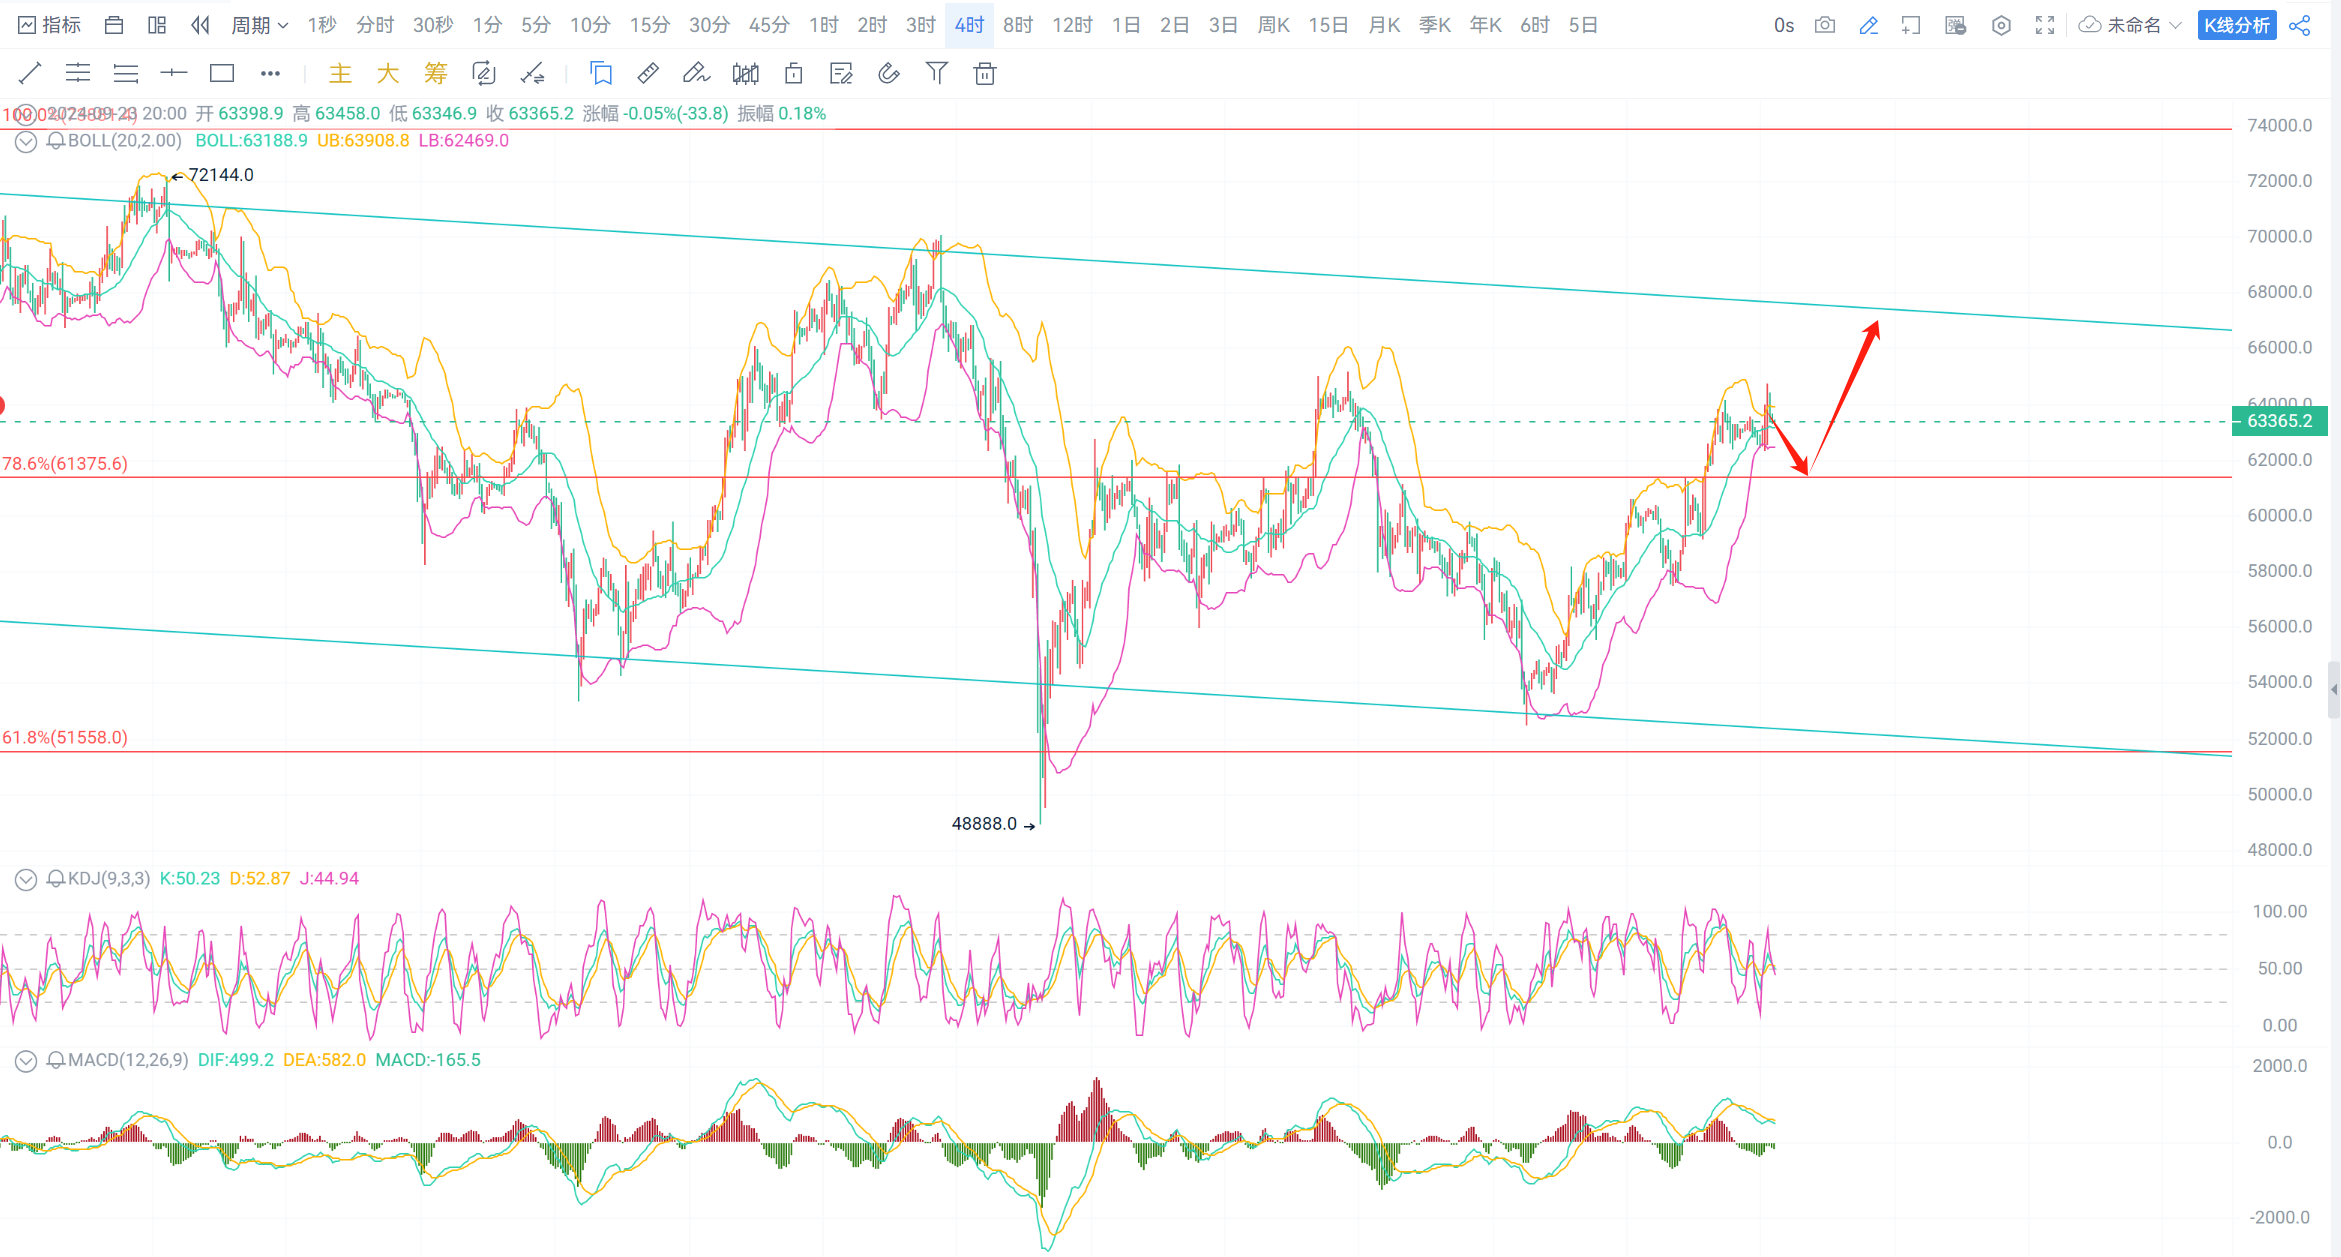
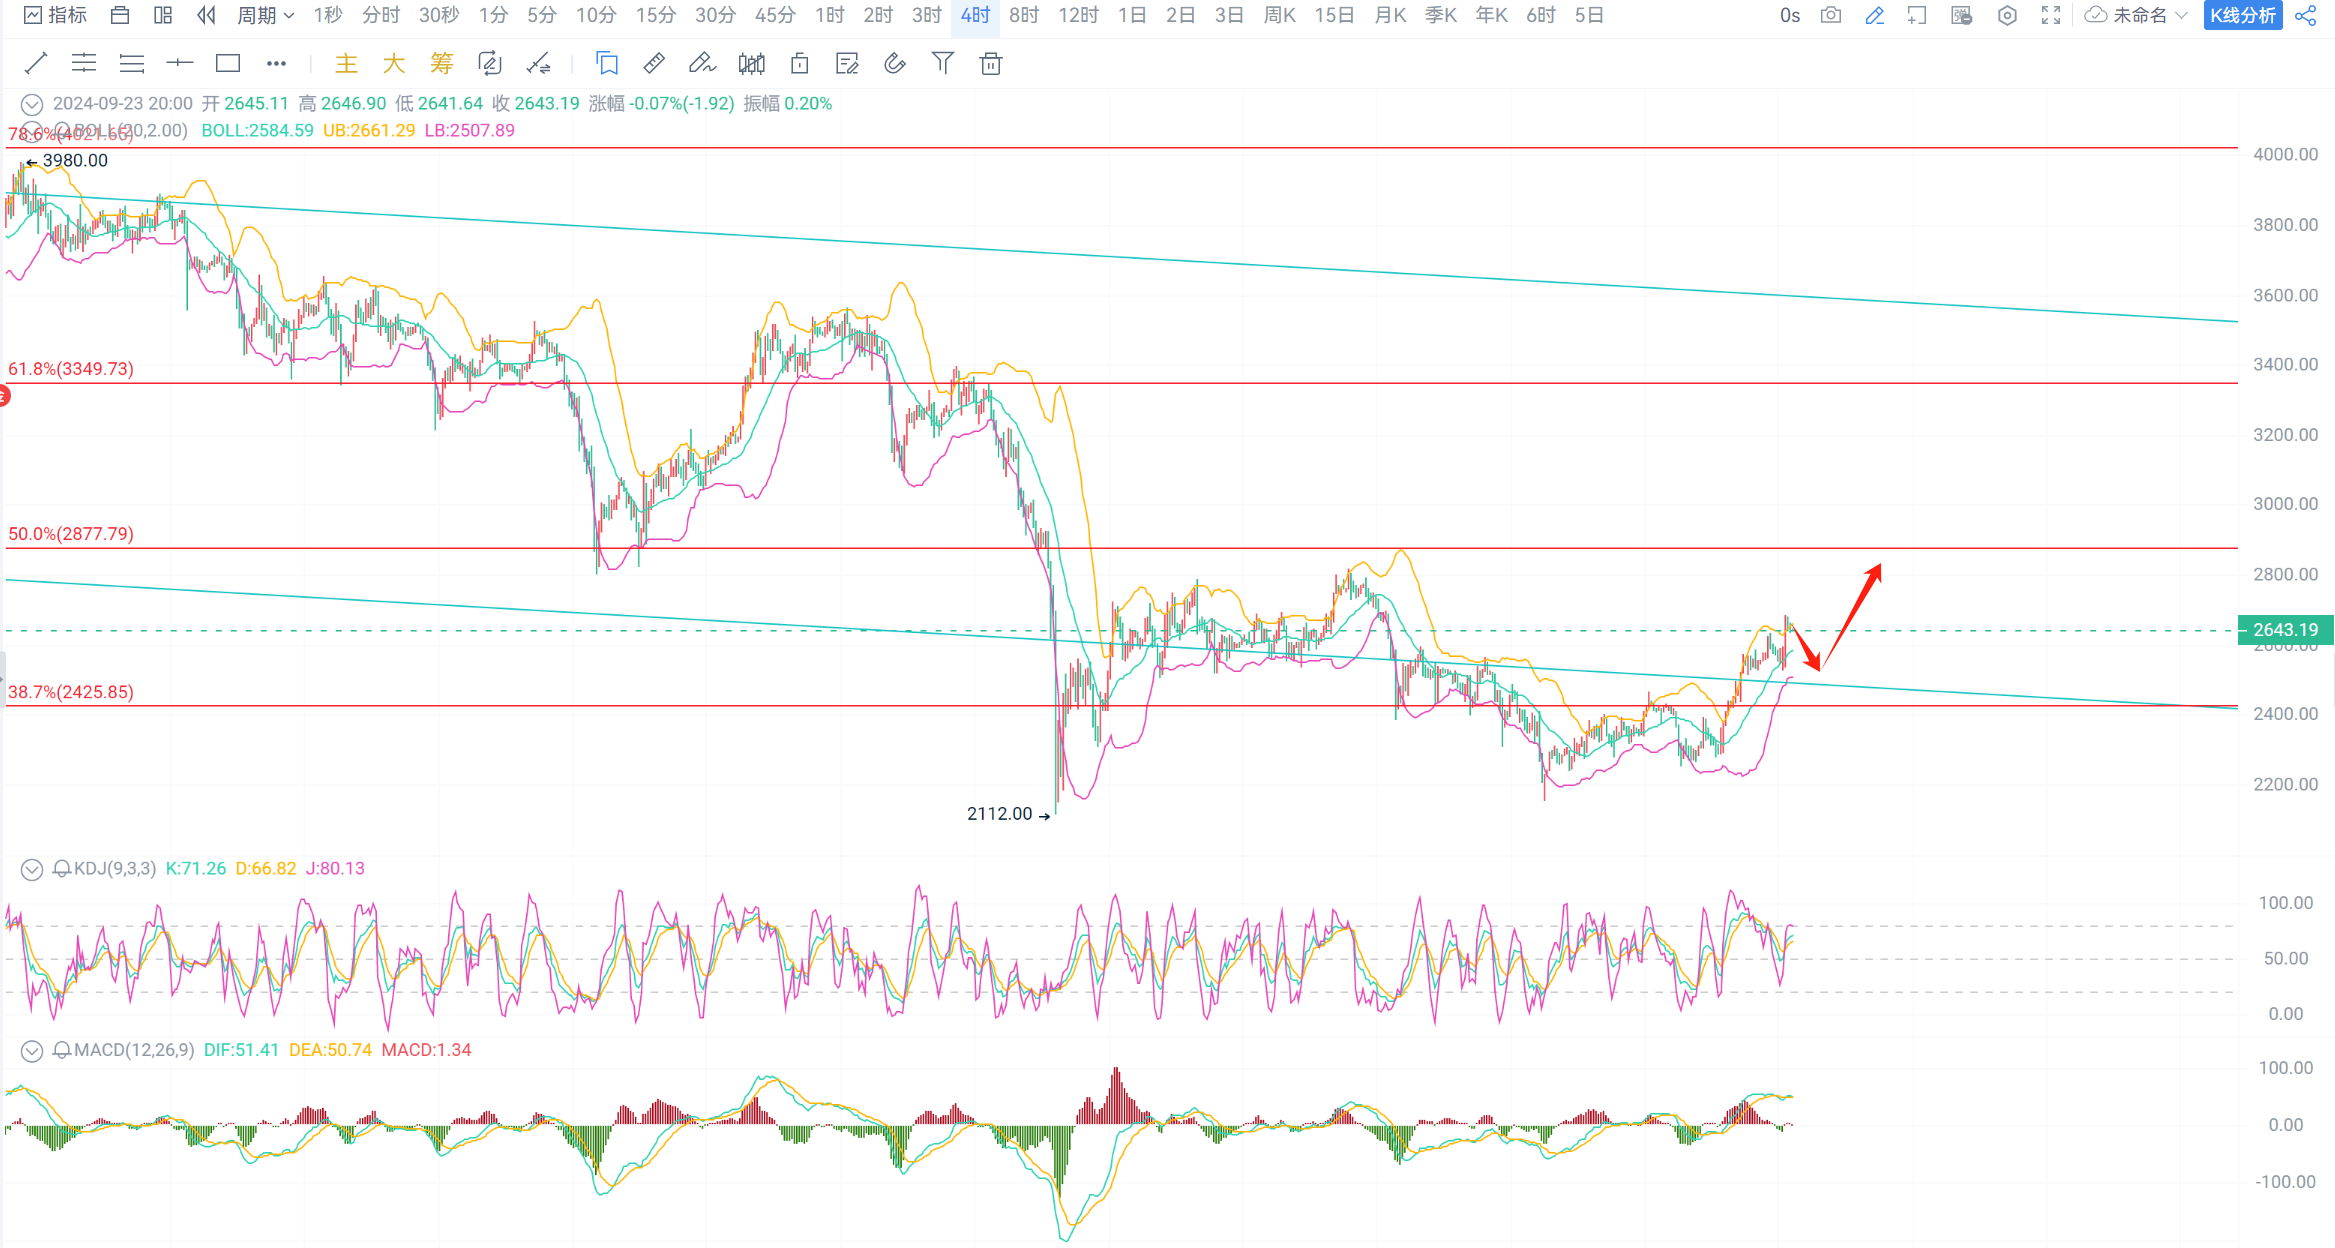
Technical analysis: Regarding Bitcoin, the weekly chart shows two consecutive bullish candles, currently above the midline of the Bollinger Bands with the bands running flat, the MACD moving average starting to run flat and upwards, the bearish volume starting to decrease, and the KDJ line moving upwards. On the daily chart, there have been 6 consecutive bullish candles after a retracement to the midline of the Bollinger Bands, with the bands continuing to expand upwards, the MACD moving average moving upwards, the bullish volume continuing to increase, and the KDJ line running flat. On the 4-hour chart, the Bollinger Bands are running flat, the MACD moving average and KDJ line have started to move downwards, and the bearish volume continues to increase. As for Ethereum, the technical indicators at all levels are basically synchronized with Bitcoin;
In summary, the current market trend is still dominated by the bulls, and there is a demand for short-term highs and pullbacks. For aggressive traders, short positions can be taken, and for conservative traders, it is advisable to wait for a pullback to support before continuing to go long!
Trading suggestion: Aggressively short!
Short Bitcoin in the 63500-64000 range, with a target of 62500-61500 and a defensive position at 64500;
Short Ethereum in the 2650-2680 range, with a target of 2600-2550 and a defensive position at 2720;
The strategy is time-sensitive, and specific guidance should be based on real-time instructions!
Follow WeChat public account "允彦"!

免责声明:本文章仅代表作者个人观点,不代表本平台的立场和观点。本文章仅供信息分享,不构成对任何人的任何投资建议。用户与作者之间的任何争议,与本平台无关。如网页中刊载的文章或图片涉及侵权,请提供相关的权利证明和身份证明发送邮件到support@aicoin.com,本平台相关工作人员将会进行核查。


