The market fluctuations of Bitcoin can be described as thrilling. The day before yesterday, Bitcoin started to plummet, but yesterday it turned around and surged. So, how will Bitcoin develop in the end? From the current situation, Bitcoin faces upward pressure and has support on the downside, and the price is at a standstill. As for the price of Bitcoin.
First, we need to look at its directional cycle. From the weekly chart analysis, Bitcoin's current trend is supported by the 30-week moving average. Since bottoming out last year, Bitcoin only fell below the 30-week moving average in the week before last, but it recovered in the following week, forming a bullish candlestick pattern. Therefore, from the perspective of the weekly chart, the price of Bitcoin still shows an upward trend, unless it effectively breaks below the 30-week moving average, this upward trend will not be broken.
Since it is an upward trend, a long bullish candlestick was formed at the end of last week, causing the 5-week and 10-week moving averages to form a golden cross above the 30-week moving average, indicating a bullish and accelerating upward trend. As for this week, after piercing through the 5-week and 10-week moving averages, it quickly rose, possibly forming a shooting star, which means a shooting star is formed at the top with a very long lower shadow.
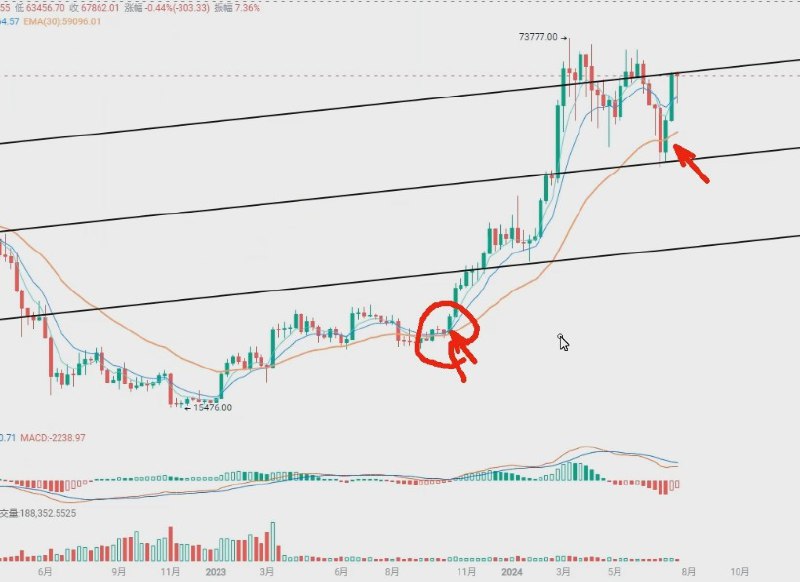
This can explain two things: the appearance of this shooting star during the upward trend indicates that the chips have become loose, while the buying pressure below is very active, indicating a certain divergence between long and short positions. If nothing unexpected happens, the closing of this week should be a definite shooting star. Of course, despite the serious divergence between long and short positions, the bulls still have the advantage. Next, since the bulls have the advantage at the weekly chart level, the buying points for Bitcoin require us to pay attention to two important points.
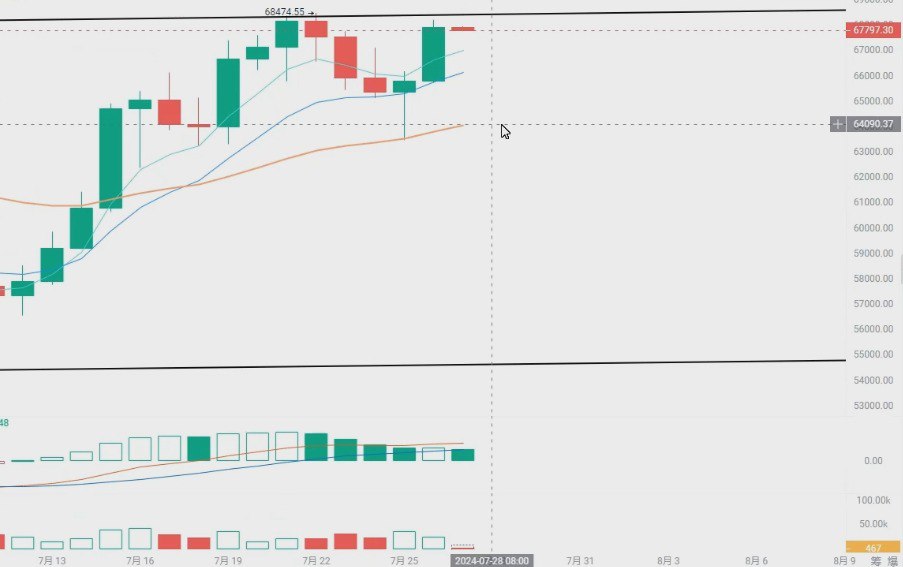
Let's first go back to the daily chart level. The price of Bitcoin formed a spinning top at the end of the day before yesterday, and the needle of this spinning top pierced the position of the 30-day moving average. The 30-day moving average happened to be the first real pullback after the recent breakthrough, so the appearance of a spinning top near the moving average is a kind of reversal candlestick.
The following day, a bullish candlestick was formed, which came near $68,500, which is the previous high and also the upper channel boundary of the daily chart level, encountering resistance, so the pressure at $68,500 is very high. Whether it can form a double top structure at the daily chart level still needs to be confirmed.
The first buying point appears when the price of Bitcoin breaks through $68,500 and confirms the pullback. This is a good spot for adding positions. Why is it said that breaking through $68,500 will become an important buying point? In fact, the position of $68,500 for Bitcoin is very similar to the position of $73,700 in March and $72,000 in mid-May, both of which are at the upper boundary of the channel. Therefore, this time is no exception, encountering pressure at the upper boundary of the channel and starting to pull back. Only by breaking through this point and getting rid of the upper pressure, can Bitcoin possibly start a new upward wave, which is a method of building positions on the right side.
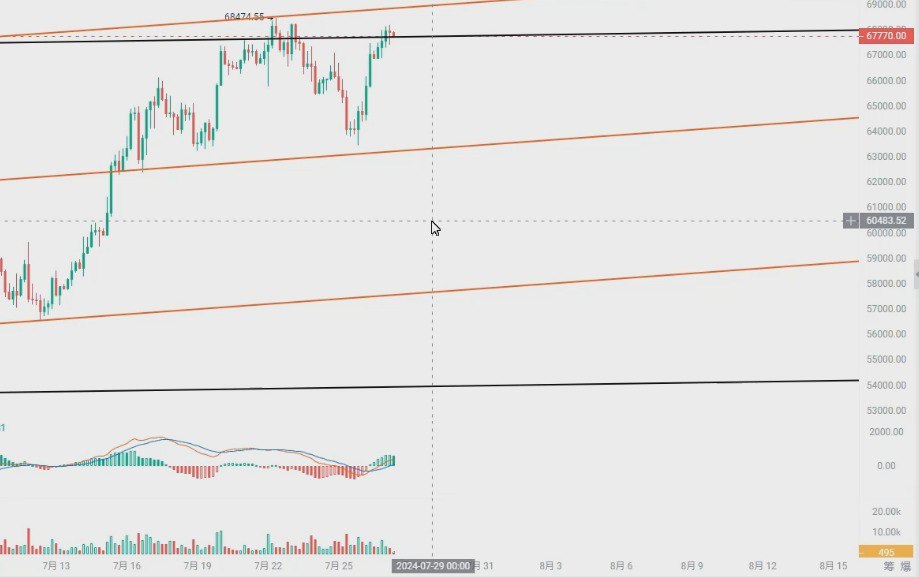
Now, where is the second important entry point? It is during the pullback. Last time, it was said that it would pull back to the 618 line of the golden ratio, which is $62,700, where we can consider entering. But this time, it only touched the lifeline of the daily chart level at $63,300. So, Bitcoin did not reach the 618 of the golden ratio, but used the 30-day moving average as an important support. If the price of Bitcoin has the opportunity to pierce through this position again, it must be an important entry point. As for the stop-loss, it is still at the 50 line of the golden ratio. Why is it said that there is a chance to pull back to this point?
Let's take a look at the 4-hour chart trend. As for the 4-hour chart, a channel can also be drawn. This channel was formed when Bitcoin reached around $53,500. Connecting the two high points and the low point, a channel can be drawn. After drifting upwards in this channel, Bitcoin has just completed two channels. In theory, after breaking through two channels, the price of Bitcoin needs a consolidation channel.
So, at the point where Bitcoin starts to rebound near $63,300, which is the lower boundary of the expanded channel, and then rises again. Is it possible for Bitcoin to return to the lower boundary of this channel again when it makes a second attempt to rise to $68,500? My view is that it is possible. So, in the range of $63,500 to $64,100, if there is an opportunity to return again, my view is to consider entering. As for the stop-loss below, it is still at the 50 line of the golden ratio, or it can be set after it breaks through the lower boundary of this channel.
This is the second entry point for Bitcoin. We say to think big and act small, because the weekly chart level is upward, at the daily chart level and even the 4-hour chart level, if there is an opportunity, we should consider entering. This is a method of thinking big and acting small.
This is today's content analysis. If you currently do not have a position, do not panic, do not chase after highs, chasing after highs is definitely not right. Only when it truly breaks through the upper pressure of $68,500, should we consider entering during the pullback, and the target point for the pullback is still around $64,000.
If you want to learn more about the secrets of wealth, or new layouts, or the new stable and profitable trading system S7 of the S7 Academy, you can contact our assistant and join the VIP.
This is all the content analysis for today. I wish everyone a happy trading!
免责声明:本文章仅代表作者个人观点,不代表本平台的立场和观点。本文章仅供信息分享,不构成对任何人的任何投资建议。用户与作者之间的任何争议,与本平台无关。如网页中刊载的文章或图片涉及侵权,请提供相关的权利证明和身份证明发送邮件到support@aicoin.com,本平台相关工作人员将会进行核查。


