Ethereum price falls by more than 7.5%, ETHE fund outflow surges
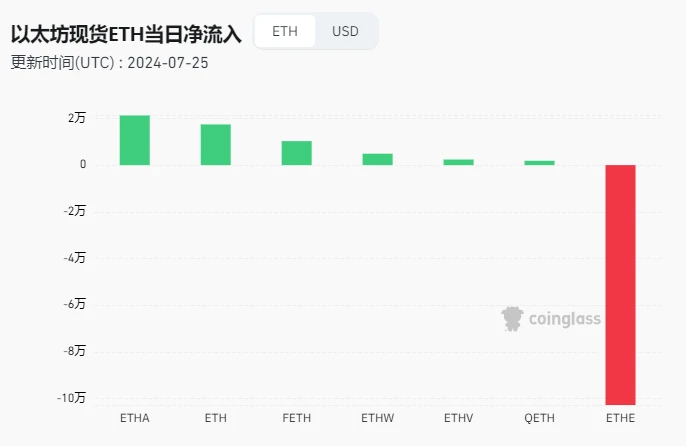
Data source: Coinglass
ETHE is Grayscale's Ethereum Trust ETF with a 2.5% fee. The overall net outflow of Ethereum spot ETF on the second day of listing was $133 million, with the main culprit being Grayscale's ETHE, leading to a significant drop in Ethereum this week, with ETH falling to around $3,100 at its lowest.
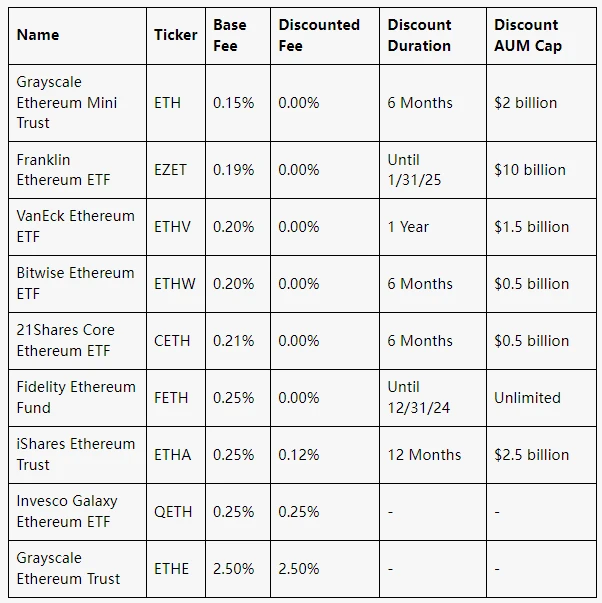
For most investors, the deciding factor comes down to fees. Eight out of nine ETFs have management fees ranging from 0.15% to 0.25%. Grayscale Ethereum Mini Trust (ETH) is a new fund created specifically for listing as an ETF, with a management fee of only 0.15%. These fees will be completely waived for the first six months after listing or until the fund's assets under management (AUM) reach $2 billion.
The next Federal Reserve interest rate meeting (2024.08.01) is about 5 days away
https://hk.investing.com/economic-calendar/interest-rate-decision-168
Market Technical and Sentiment Analysis
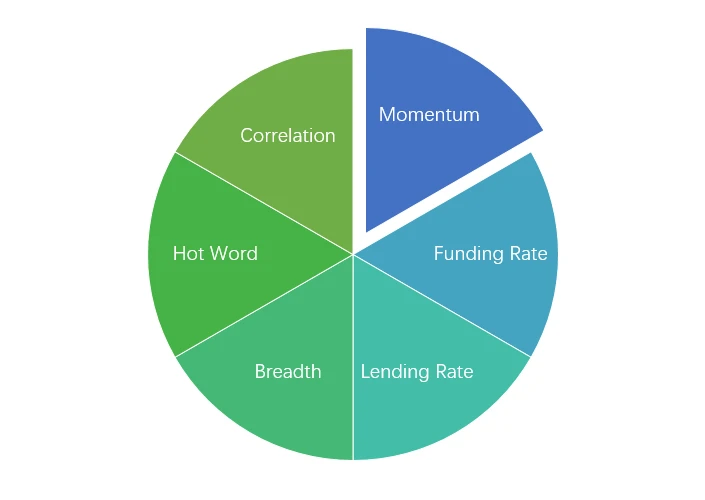
Sentiment Analysis Composition
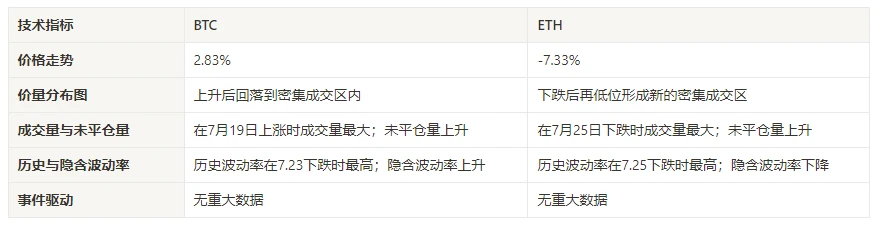
Technical Indicators
Price Trend
BTC price rose by 2.83% in the past week, while ETH price fell by -7.33%.
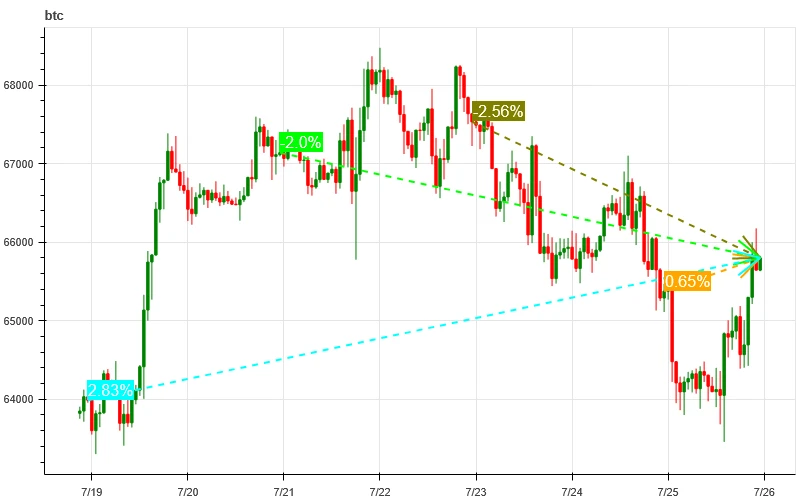
The above chart shows the price trend of BTC over the past week.
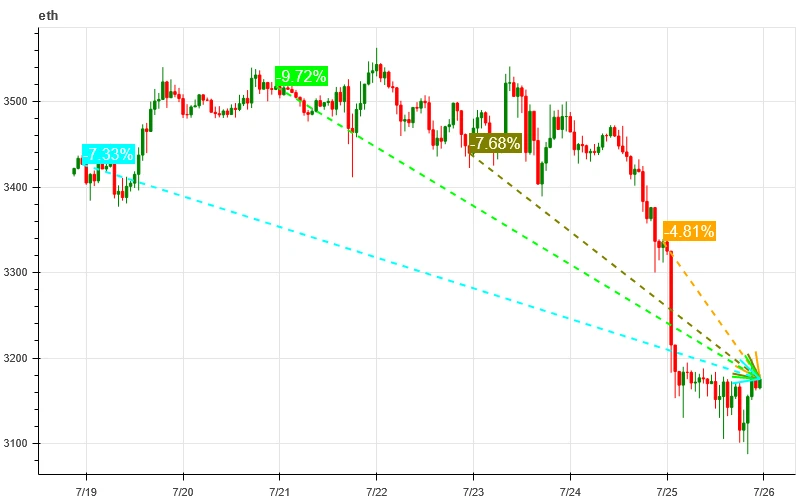
The above chart shows the price trend of ETH over the past week.
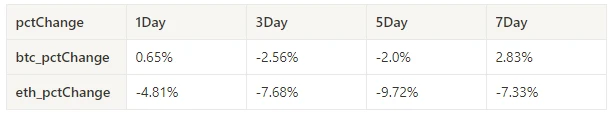
The table shows the price change rate over the past week.
Price-Volume Distribution Chart (Support and Resistance)
After rising in the past week, BTC fell back to the dense trading area, while ETH fell and formed a new dense trading area at a low level.
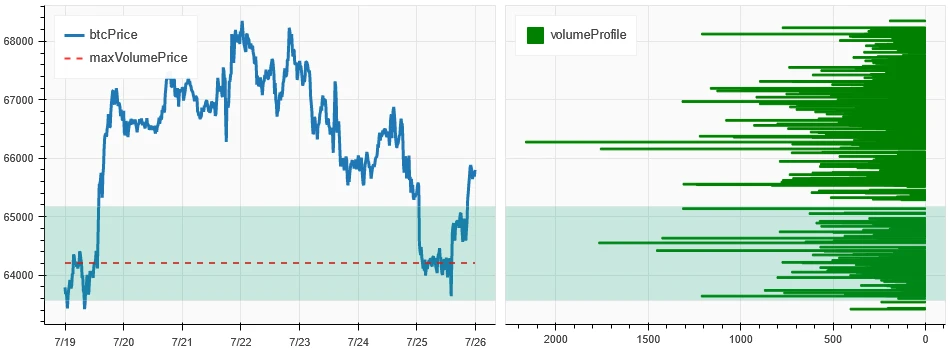
The above chart shows the distribution of the dense trading area for BTC over the past week.
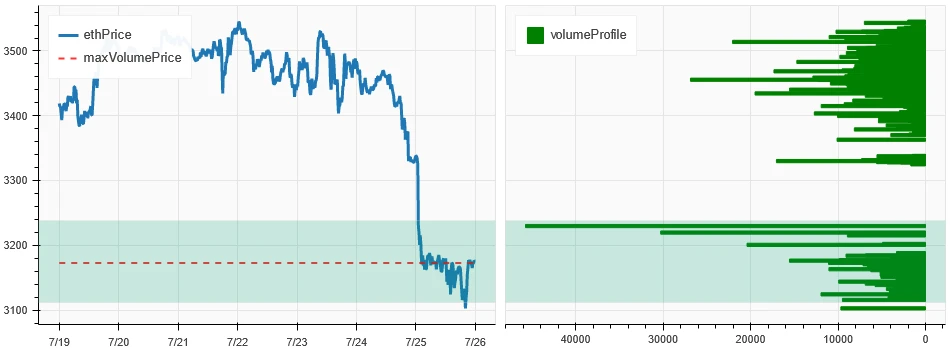
The above chart shows the distribution of the dense trading area for ETH over the past week.
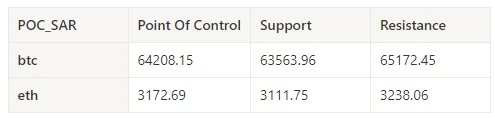
The table shows the dense trading range for BTC and ETH in each week over the past week.
Volume and Open Interest
In the past week, the largest volume for BTC was on July 19th when it rose, while for ETH it was on July 25th when it fell; both BTC and ETH saw an increase in open interest.
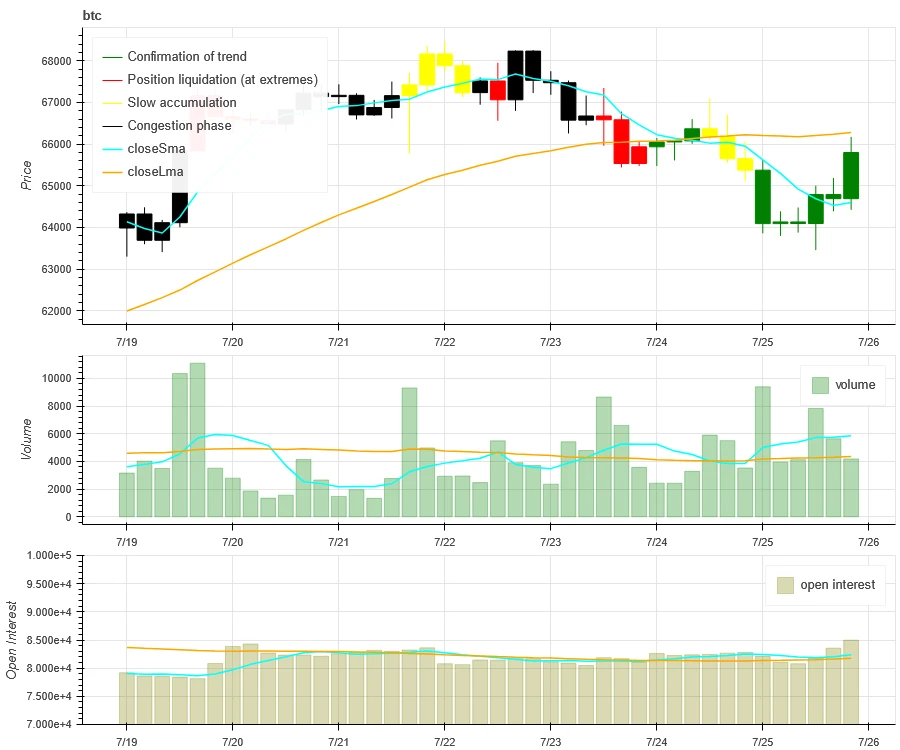
The top section of the above chart shows the price trend of BTC, the middle section shows the volume, and the bottom section shows the open interest. The light blue represents the 1-day average, and the orange represents the 7-day average. The color of the candlestick represents the current state, with green indicating price increase supported by volume, red indicating closing positions, yellow indicating slow accumulation of positions, and black indicating crowded conditions.
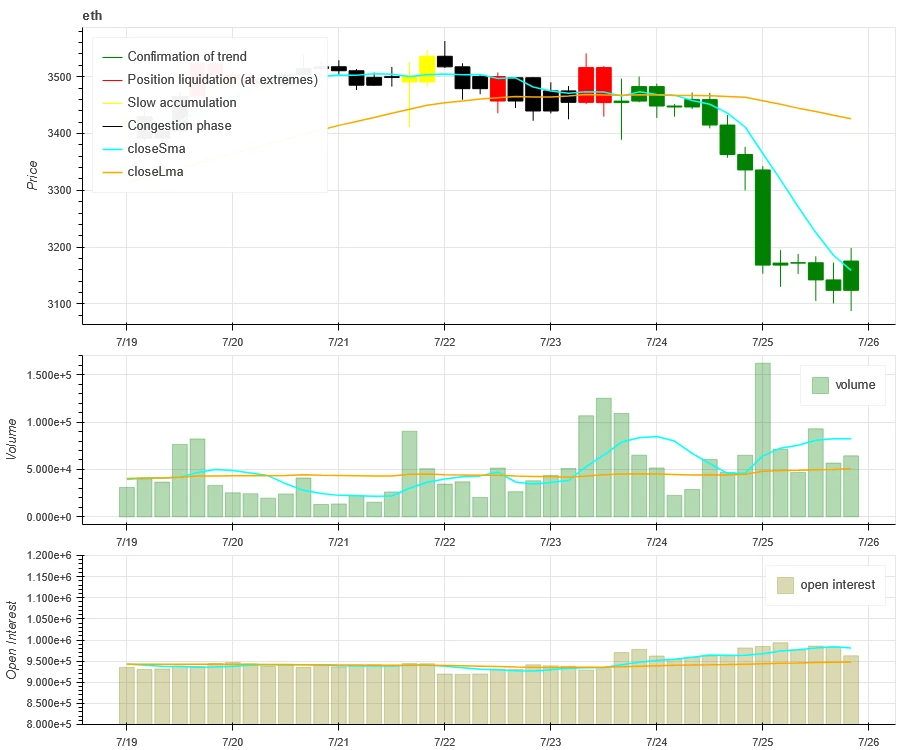
The top section of the above chart shows the price trend of ETH, the middle section shows the volume, and the bottom section shows the open interest. The light blue represents the 1-day average, and the orange represents the 7-day average. The color of the candlestick represents the current state, with green indicating price increase supported by volume, red indicating closing positions, yellow indicating slow accumulation of positions, and black indicating crowded conditions.
Historical Volatility and Implied Volatility
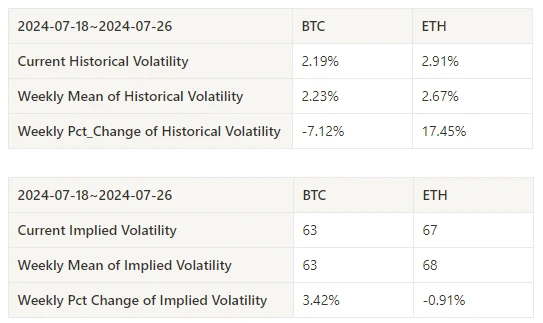
The highest historical volatility for BTC in the past week was on July 23, and for ETH it was on July 25; implied volatility rose for BTC and fell for ETH.
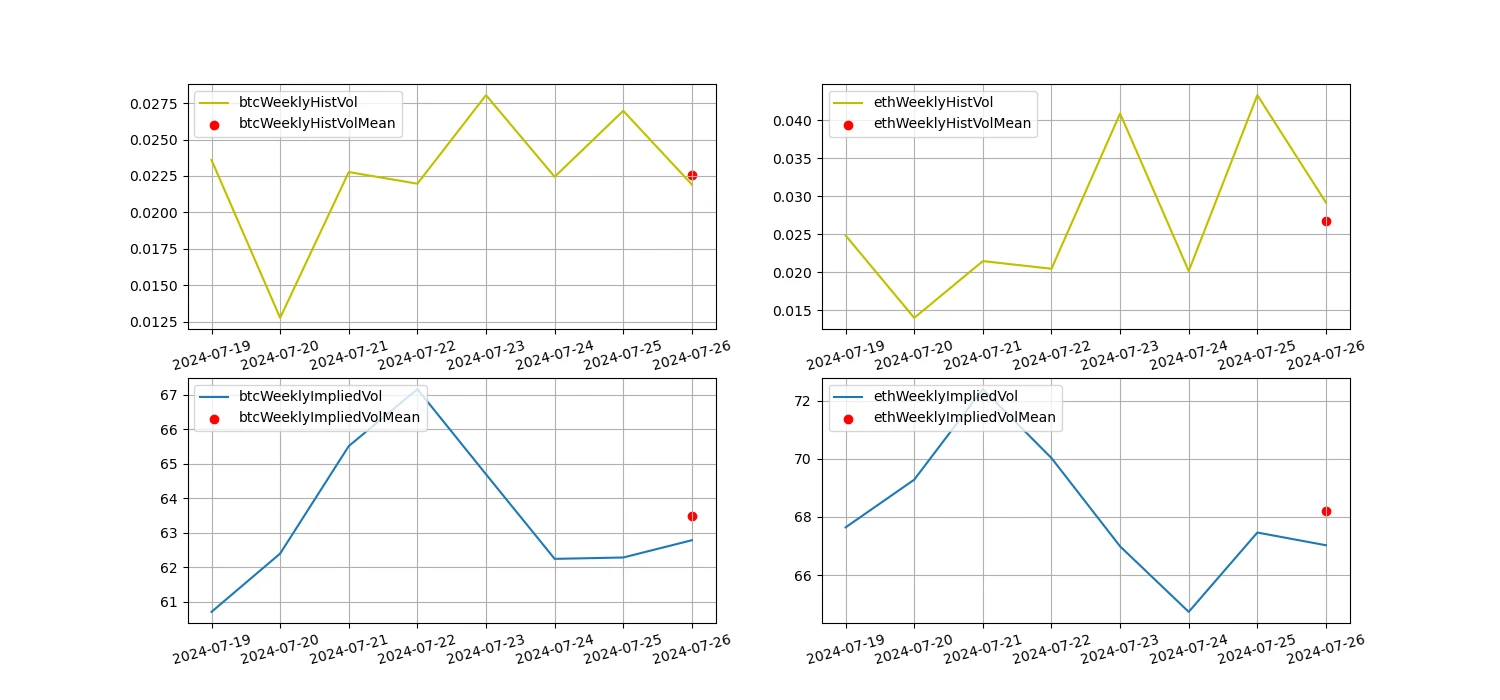
The yellow line represents historical volatility, the blue line represents implied volatility, and the red dots are the 7-day average.
Event-Driven
No significant data was released in the past week.
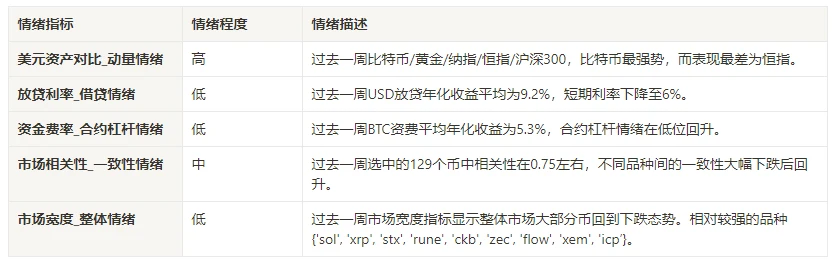
Sentiment Indicators
Momentum Sentiment
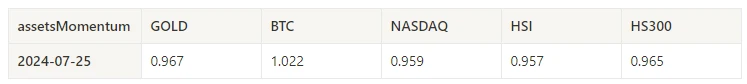
In the past week, among Bitcoin/Gold/Nasdaq/Hang Seng/CSI 300, Bitcoin was the strongest performer, while Hang Seng performed the worst.
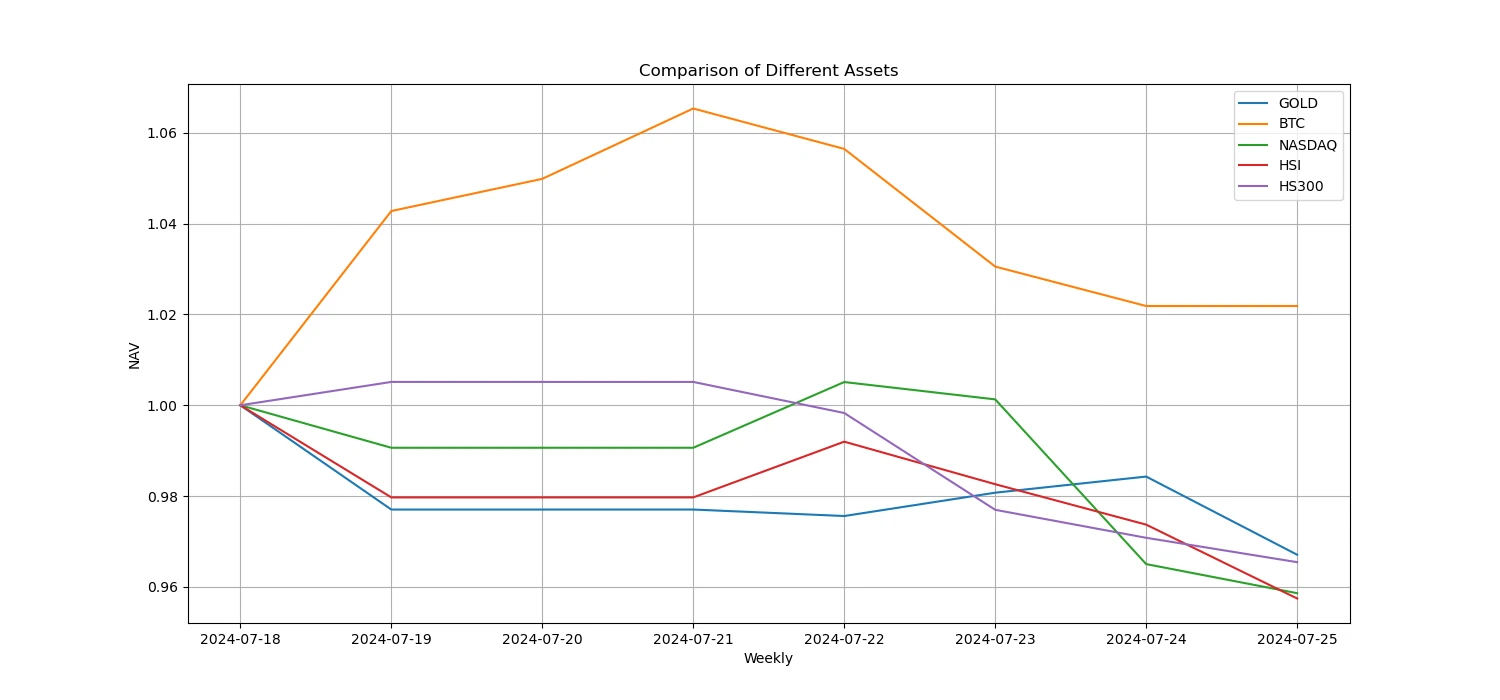
The above chart shows the performance of different assets over the past week.
Lending Rate and Borrowing Sentiment
The average annualized USD lending yield in the past week was 9.2%, and the short-term interest rate dropped to 6%.
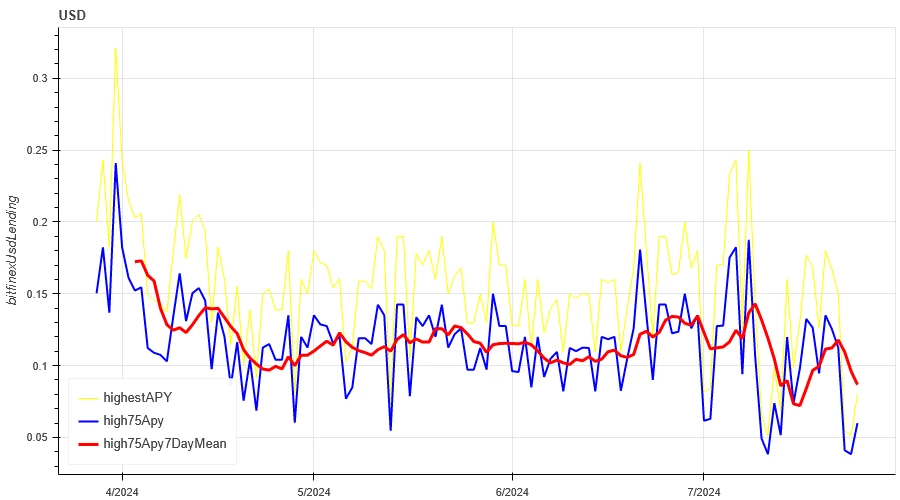
The yellow line represents the highest USD interest rate, the blue line represents 75% of the highest rate, and the red line represents the 7-day average of 75% of the highest rate.
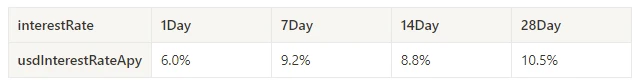
The table shows the average yield of USD interest rates for different holding periods.
Funding Rate and Contract Leverage Sentiment
The average annualized yield for BTC funding rate in the past week was 5.3%, and the contract leverage sentiment rebounded from a low level.
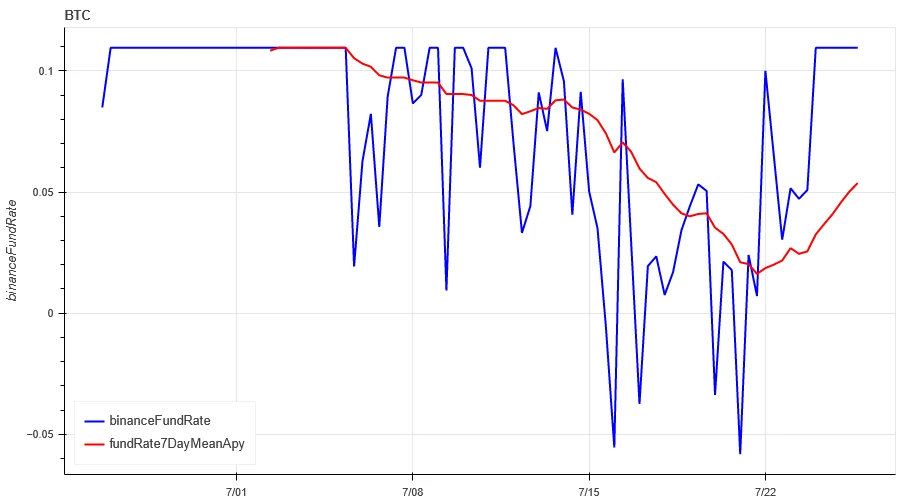
The blue line represents the funding rate for BTC on Binance, and the red line represents its 7-day average.
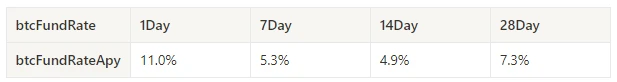
The table shows the average yield of BTC funding rates for different holding periods.
Market Correlation and Consistency Sentiment
Among the selected 129 coins in the past week, the correlation was around 0.75, and the consistency between different varieties sharply declined before rebounding.
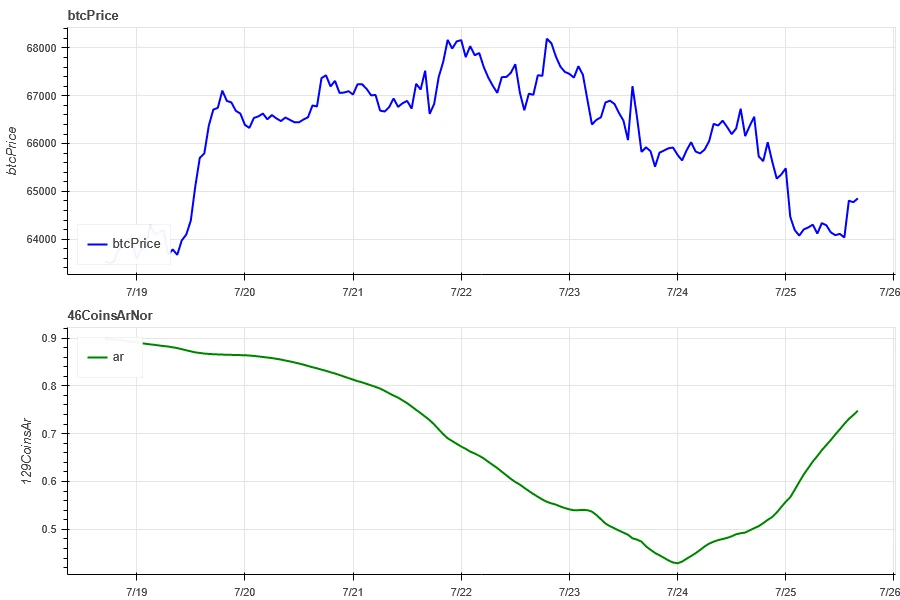
The blue line represents the Bitcoin price, and the green line represents the overall correlation between different varieties: ['1000floki', '1000lunc', '1000pepe', '1000shib', '1000xec', '1inch', 'aave', 'ada', 'agix', 'algo', 'ankr', 'ant', 'ape', 'apt', 'arb', 'ar', 'astr', 'atom', 'audio', 'avax', 'axs', 'bal', 'band', 'bat', 'bch', 'bigtime', 'blur', 'bnb', 'btc', 'celo', 'cfx', 'chz', 'ckb', 'comp', 'crv', 'cvx', 'cyber', 'dash', 'doge', 'dot', 'dydx', 'egld', 'enj', 'ens', 'eos','etc', 'eth', 'fet', 'fil', 'flow', 'ftm', 'fxs', 'gala', 'gmt', 'gmx', 'grt', 'hbar', 'hot', 'icp', 'icx', 'imx', 'inj', 'iost', 'iotx', 'jasmy', 'kava', 'klay', 'ksm', 'ldo', 'link', 'loom', 'lpt', 'lqty', 'lrc', 'ltc', 'luna2', 'magic', 'mana', 'matic', 'meme', 'mina', 'mkr', 'near', 'neo', 'ocean', 'one', 'ont', 'op', 'pendle', 'qnt', 'qtum', 'rndr', 'rose', 'rune', 'rvn', 'sand', 'sei', 'sfp', 'skl', 'snx', 'sol', 'ssv', 'stg', 'storj', 'stx', 'sui', 'sushi', 'sxp', 'theta', 'tia', 'trx', 't', 'uma', 'uni', 'vet', 'waves', 'wld', 'woo', 'xem', 'xlm', 'xmr', 'xrp', 'xtz', 'yfi', 'zec', 'zen', 'zil', 'zrx’]
Market Breadth and Overall Sentiment
Among the selected 129 coins in the past week, 30% were above the 30-day moving average, compared to 10% for BTC, 15% were more than 20% above the lowest price in the past 30 days, and 20% were less than 10% below the highest price in the past 30 days. The market breadth indicator in the past week shows that most coins in the overall market have returned to a downward trend.
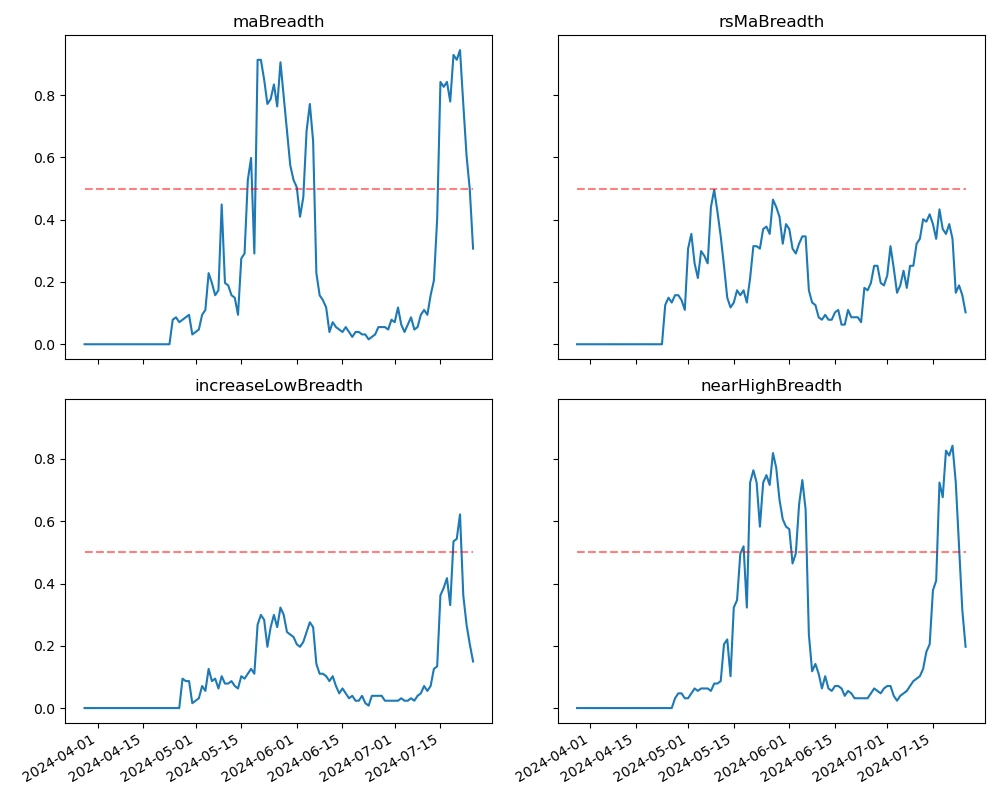
The above chart shows the 30-day width index distribution of the following assets: ['bnb', 'btc', 'sol', 'eth', '1000floki', '1000lunc', '1000pepe', '1000sats', '1000shib', '1000xec', '1inch', 'aave', 'ada', 'agix', 'ai', 'algo', 'alt', 'ankr', 'ape', 'apt', 'arb', 'ar', 'astr', 'atom', 'avax', 'axs', 'bal', 'band', 'bat', 'bch', 'bigtime', 'blur', 'cake', 'celo', 'cfx', 'chz', 'ckb', 'comp', 'crv', 'cvx', 'cyber', 'dash', 'doge', 'dot', 'dydx', 'egld', 'enj', 'ens', 'eos','etc', 'fet', 'fil', 'flow', 'ftm', 'fxs', 'gala', 'gmt', 'gmx', 'grt', 'hbar', 'hot', 'icp', 'icx', 'idu', 'imx', 'inj', 'iost', 'iotx', 'jasmy', 'jto', 'jup', 'kava', 'klay', 'ksm', 'ldo', 'link', 'loom', 'lpt', 'lqty', 'lrc', 'ltc', 'luna2', 'magic', 'mana', 'manta', 'mask', 'matic', 'meme', 'mina', 'mkr', 'near', 'neo', 'nfp', 'ocean', 'one', 'ont', 'op', 'ordi', 'pendle', 'pyth', 'qnt', 'qtum', 'rndr', 'robin', 'rose', 'rune', 'rvn', 'sand', 'sei', 'sfp', 'skl', 'snx', 'ssv', 'stg', 'storj', 'stx', 'sui', 'sushi', 'sxp', 'theta', 'tia', 'trx', 't', 'uma', 'uni', 'vet', 'waves', 'wif', 'wld', 'woo','xai', 'xem', 'xlm', 'xmr', 'xrp', 'xtz', 'yfi', 'zec', 'zen', 'zil', 'zrx' ]
Summary
In the past week, the market performance of Bitcoin and Ethereum differed. Bitcoin experienced wide fluctuations within a range, with the trading volume reaching its peak on July 19th as the open interest increased, and the implied volatility rose. The funding rate also rebounded, indicating a warming market sentiment. On the other hand, Ethereum's price fell after oscillating, mainly influenced by the outflow of ETHE funds. The trading volume reached its peak on July 25th as the open interest increased, and the implied volatility decreased. The market breadth indicator shows that most cryptocurrencies have returned to a downward trend, indicating a predominantly bearish market over the past week.
Twitter: @https://x.com/CTA_ChannelCmt
Website: channelcmt.com
免责声明:本文章仅代表作者个人观点,不代表本平台的立场和观点。本文章仅供信息分享,不构成对任何人的任何投资建议。用户与作者之间的任何争议,与本平台无关。如网页中刊载的文章或图片涉及侵权,请提供相关的权利证明和身份证明发送邮件到support@aicoin.com,本平台相关工作人员将会进行核查。


