July 27th Airborne: Bitcoin's attempt to rise is blocked, intraday trend analysis and operational strategies
The torment of cold and hot, the test of decline and rise, those who are not smooth suffer losses, while those who are successful make money in both long and short positions, which highlights the importance of the connection between time and position. "Wash and sleep" is not a phrase directed at me, but at you. Participating in the beauty of waiting is my pseudonym, and it is also my hope for you. Although the profit may not be large, the advantage lies in the certainty of making money. The more significant aspect is the success in both long and short positions. Those with stop-loss orders are swept up and down, while those without stop-loss orders suffer psychological torment. At this moment, what is needed is not comfort, but the possibility of your position being resolved. Perhaps this is the meaning of my continued persistence~
BTC/Daily Chart
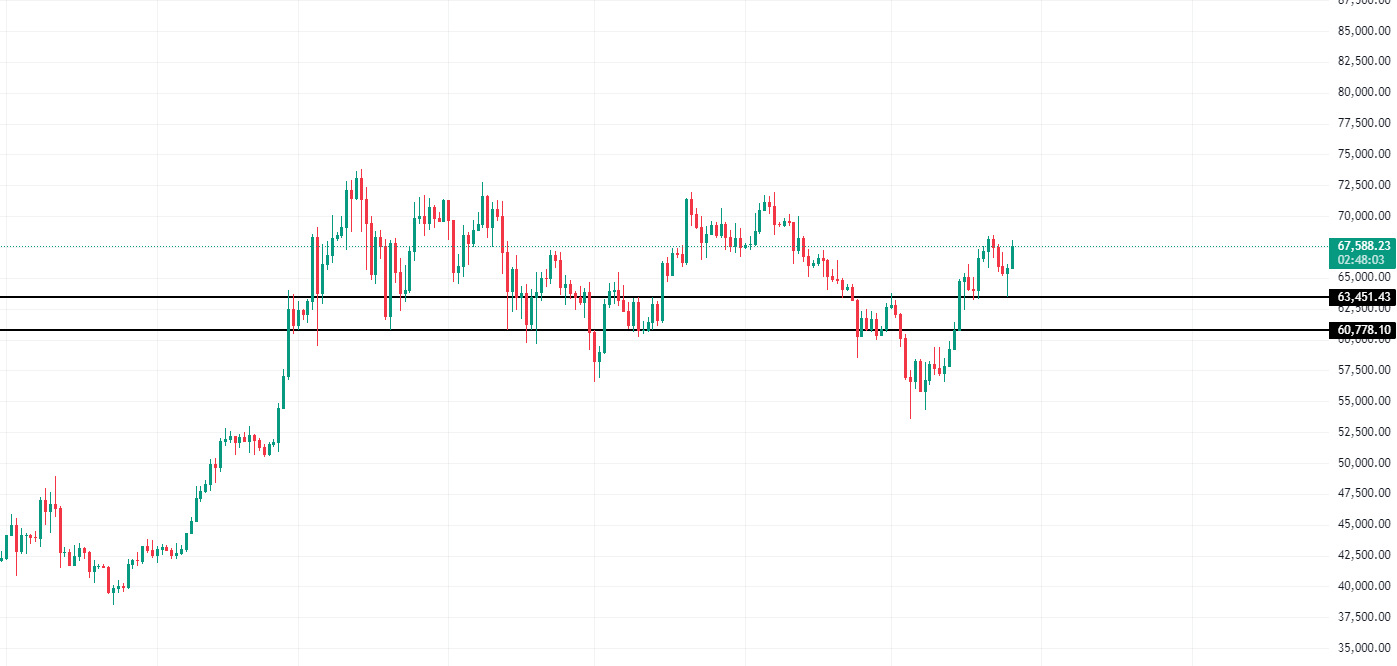
Bitcoin daily chart: The price took a sharp dive this Friday, and the volatility was quite intense. It first plummeted from around 66000 to 63300, forming a continuous decline on the daily chart. Subsequently, the price quickly rose again, returning to around 68000 to test the high point of 68500. From the current trend, the trend still maintains a strong correction phase. The short-term indicators in the chart do not indicate a significant rise, and the market's return to strength will require at least 7-15 trading days, probably extending until mid-August. Therefore, it is not wise to be bullish in the short term.
BTC/4-hour Chart
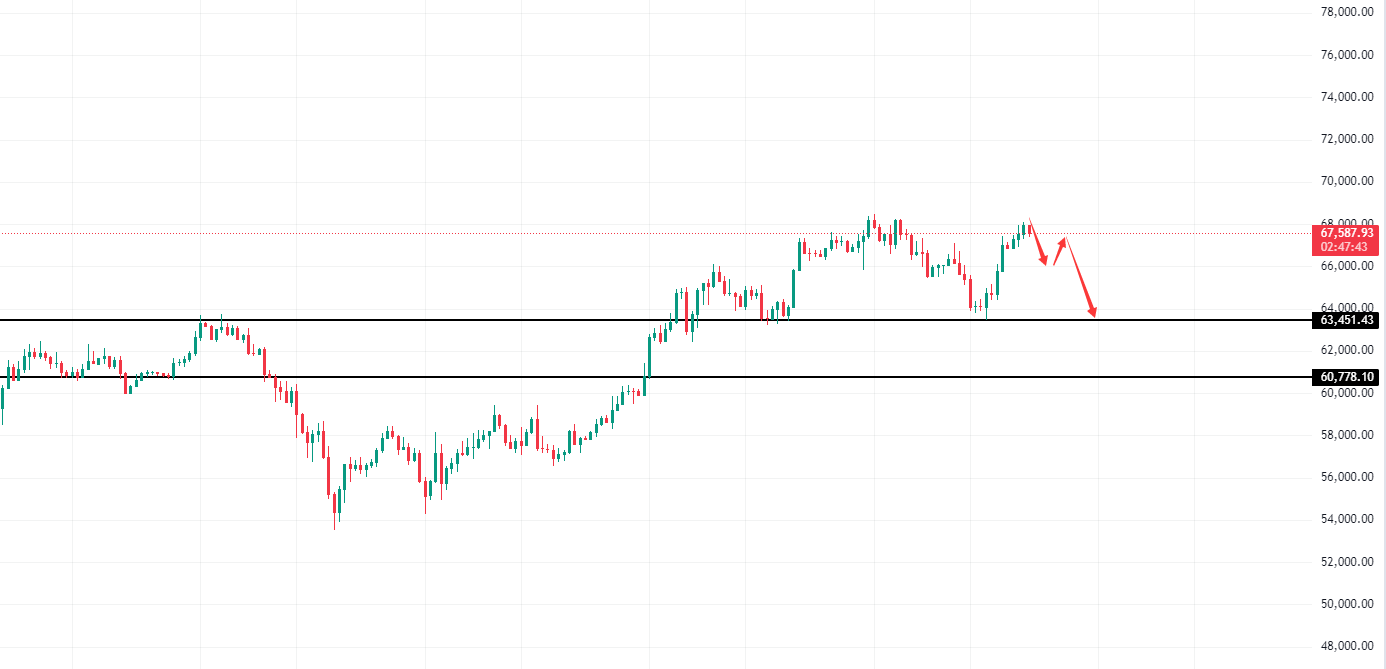
Bitcoin 4-hour chart: The price is currently trading around 67800, and the short-term indicators in the chart are upward. In addition, as it is the weekend today, the continuity of the uptrend is not strong. It is also important to pay attention to the distribution of various channels along the way, as it can effectively deduce where the next key support or resistance is likely to be. Today, the support at 66900 is worth noting first, followed by the position at 65500. This is likely to continue until next week, so today, patiently wait for the rebound to go short.
BTC/1-hour Chart
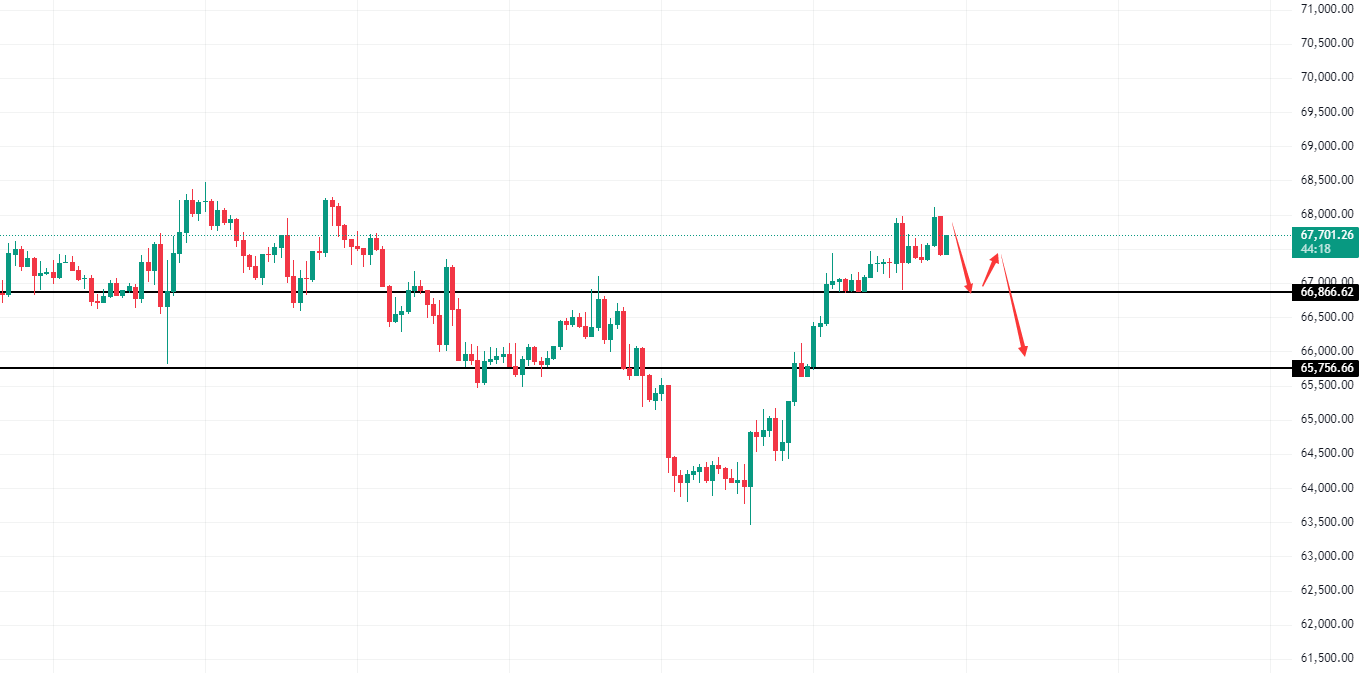
Bitcoin 1-hour chart: Currently in a high-level correction phase, as can be clearly seen from the chart, the upper resistance is at 68500, and the support is concentrated around 66900. Therefore, it is undergoing a transition through box consolidation to digest downward energy. Therefore, today's operation suggests a tendency to be bearish within the range of 68500 to 66900.
Strategy 1: It is recommended to short in batches between 68000 and 68400, with a stop loss at 68800, and the target is around 67500 to 67000.
The above is a personal suggestion, for reference only. Investment involves risks, and trading should be cautious.
There is a delay in posting, and the market is constantly changing. The points mentioned in the article do not serve as a basis for following orders. For more information on the market and resolving positions, refer to the real-time strategy of "Airborne"
Scan the QR code below to follow the official account: "Band Airborne"

Comprehensive guidance time: 7:00 am to 2:00 am the next day
This article is original by "Band Airborne," with over ten years of investment experience, having handled funds at the level of tens of millions, familiar with the operation of main funds, the methods of washing and absorbing chips, and raising prices. It can achieve the integration of knowledge and action in fund management, position control, investment portfolio, and investment mentality. It is good at judging and analyzing the overall market trend, proficient in various candlestick technical tactics, and has deep insights into wave theory, form theory, and index theory. Scan and follow the official account above for technical market learning and communication.
免责声明:本文章仅代表作者个人观点,不代表本平台的立场和观点。本文章仅供信息分享,不构成对任何人的任何投资建议。用户与作者之间的任何争议,与本平台无关。如网页中刊载的文章或图片涉及侵权,请提供相关的权利证明和身份证明发送邮件到support@aicoin.com,本平台相关工作人员将会进行核查。


