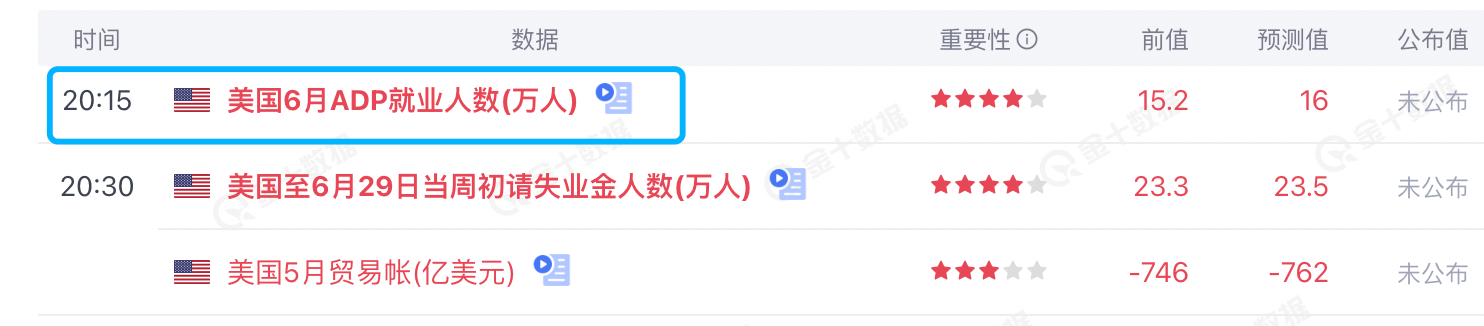
Title: AICoin
Macro Data Analysis:

① Tonight, the focus will be on the ADP employment data, known as "small non-farm", which has a forward-looking significance for the major non-farm data on Friday. The previous value was 152,000, and the forecast value is 160,000. If the data exceeds expectations, it will be bullish for the US dollar and bearish for cryptocurrencies such as BTC; conversely, if it is lower than expected, it will be bearish for the US dollar and bullish for the crypto market.
② Next is the Independence Day holiday in the United States on July 4th. The New York Stock Exchange and CME will only trade for half a day and close early, which may affect the trading volume of BTC spot and futures ETFs. It is expected that there will be greater volatility when the ADP data is released in the early part of the night, and the volatility may decrease in the early morning hours. However, occasional thin trading volumes may also provide opportunities for market manipulation by major players, which we need to be aware of.
③ Last night, the three major US stock indexes rose again before Independence Day, approaching historical highs. However, Independence Day is also an important time point in the past, and usually, the US stock market will decline after the holiday, which may also have an impact on the crypto market.
Data Analysis:
The data of Bitcoin spot trading volume shows continuous selling pressure for over 40 days, leading to price declines.

① The cumulative volume delta (CVD) data of Bitcoin spot trading volume shows that the significant buying power in BTC spot this year is clearly related to the historical high point of Bitcoin in March (green bars represent buying increment, and the yellow box is the historical high point at around $73,000 from late January to mid-March). The surge in buying volume at that time may be attributed to the enhanced investor confidence after the launch of spot ETFs and the continuous growth of institutional interest, which were the main driving forces behind the previous market uptrend.
② After the Bitcoin halving on April 20th this year, the CVD shows occasional increases in buying volume, but mainly it has experienced significant selling pressure, especially from late May to the present, with almost 40 days of continuous selling in the spot market (blue oval annotation, red volume bars represent spot net selling volume). It is rare to see a net increase in spot buying volume over such a long period. This selling pressure has also affected investor sentiment and led to price declines.

③ Historically, the long-term CVD chart shows periods of buying and selling activities consistent with the Bitcoin price cycle. The large buying volume at the end of 2020 and the beginning of 2021 (yellow box), as well as the selling period in mid-2021 and 2022 (blue box), also demonstrate the cyclical nature of market behavior. The current trend indicates that BTC is facing sustained selling pressure, and only a sustained increase in buying volume in the future may support a price increase; otherwise, it will continue to decline.
④ Regarding the CVD indicator, a brief introduction is provided here. It measures the net difference between the cumulative trading volumes of buying and selling, emphasizing the difference in trading volumes when either the buyer or the seller has an advantage. It includes trading in all fiat currencies and stablecoins.
Follow us: AICoin
免责声明:本文章仅代表作者个人观点,不代表本平台的立场和观点。本文章仅供信息分享,不构成对任何人的任何投资建议。用户与作者之间的任何争议,与本平台无关。如网页中刊载的文章或图片涉及侵权,请提供相关的权利证明和身份证明发送邮件到support@aicoin.com,本平台相关工作人员将会进行核查。


