
短线插针至58400后我们提醒阶段下跌结束接下来看反弹高度,底部窄幅震荡一个星期期,绝大部分人失去耐心,新月第一天迎来好消息,大饼下跌通道突破,以太收敛三角突破。
24/06/25BTC向下插针58400,阶段下跌已经结束,盘面即将开启反弹!
24/06/26BTC周月线将收线,日线重返箱体底部,是否会出现二探机会?
24/06/27BTC二探继续走强,ETH三角底部再反弹,接下来会反弹到哪里?

大饼二探60063后继续反弹,4小时三浪完成62500突破,以太5次测试3355一线均获得支撑,本身以太走的就比较强势。贪婪恐惧指数反弹回53,多头绝大部分头寸已被清算。
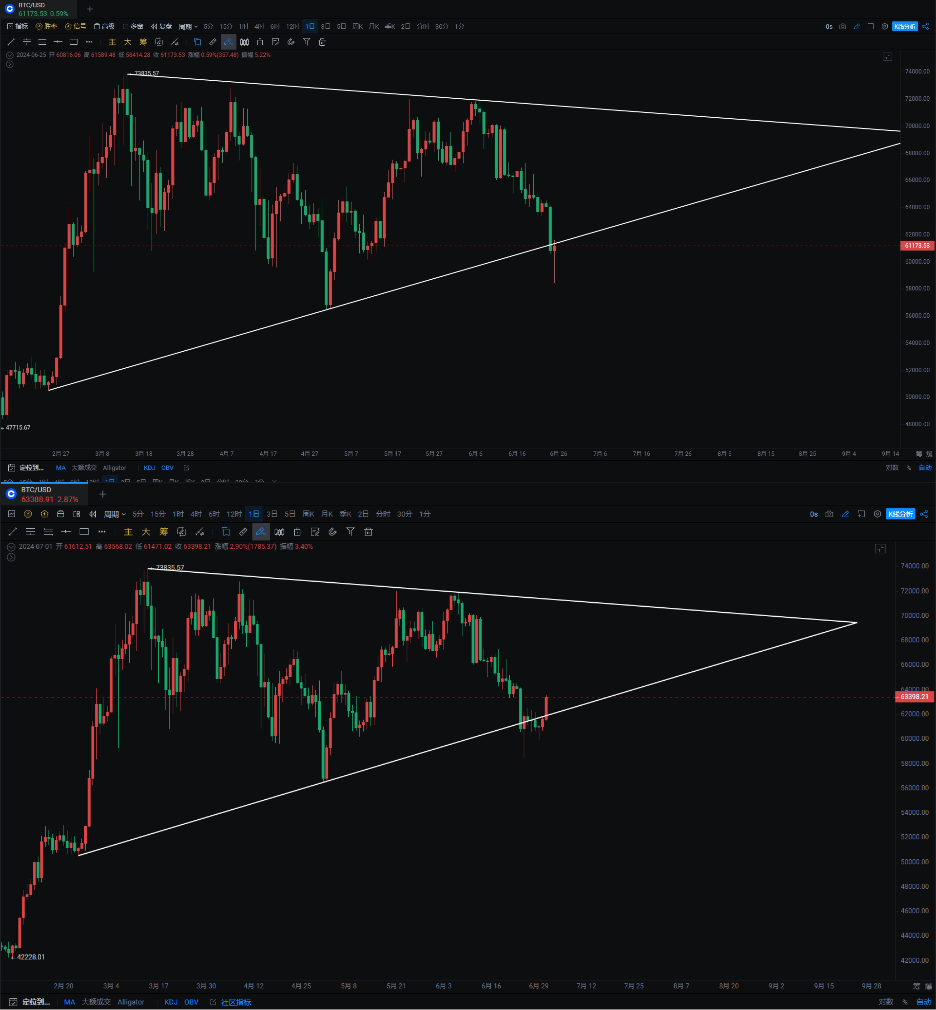
大饼
新月开盘还是在震荡4个月的箱体内部,尽管现在全网看空,散户恐慌情绪蔓延。我们也在两次72000附近提醒会下跌暴跌。但是回到支撑4个月的底部反而相对乐观。6月25号我们就提醒阶段下跌已经结束,盘面看反弹,后又提醒二探机会59600—60600(内部),周线技术指标比较拉胯跌破BOLL中轨,接下来2—3周如果能收回,那么继续走箱体震荡60000—72000。
第二种反弹不能重新站回中轨将再次考验58400—60000支撑,且跌至44000—50000概率偏大。
短线上日线4小时下跌趋势突破,最高触及63600附近,从60000附近也拉起来3000多点,58400的底极少数人能接到,但是60000附近我们明确提醒二探机会,虽然等了一个星期有点久但最终值得。
支撑:
压力:
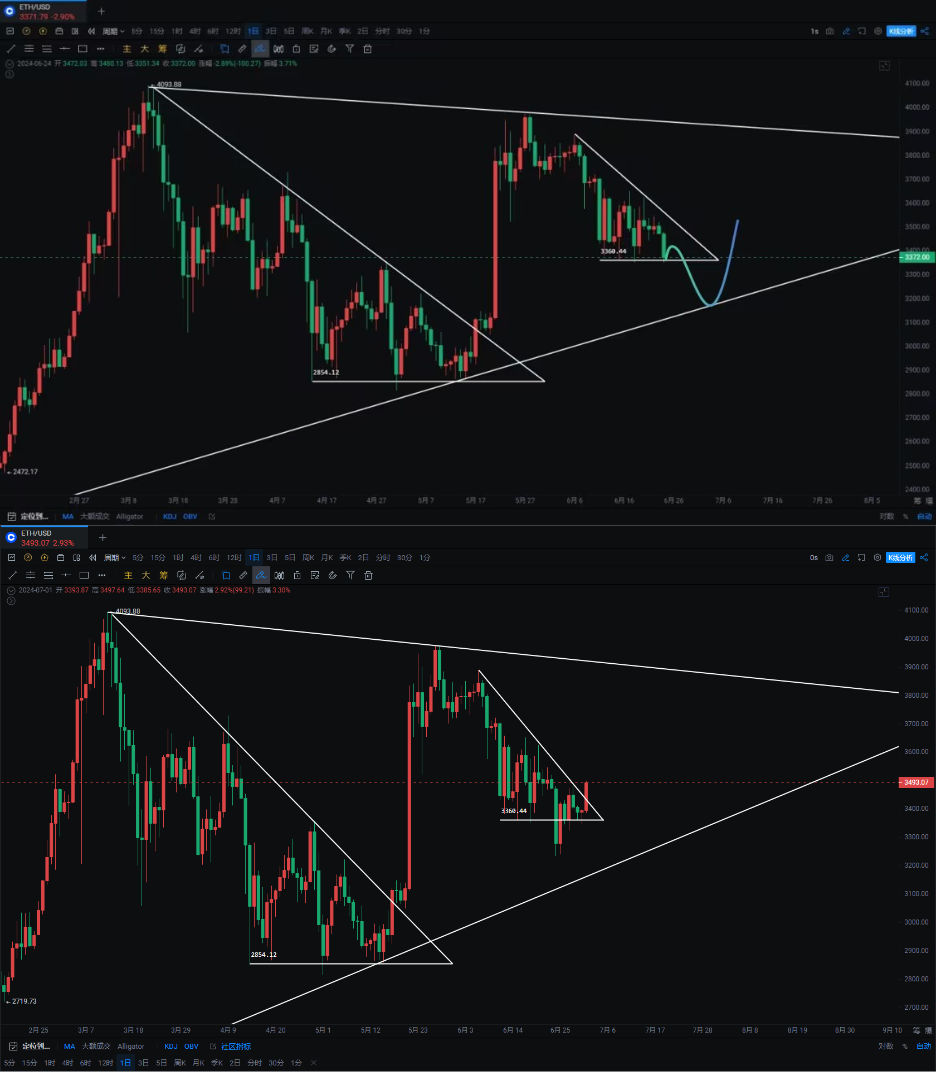
以太
以太走的K线有点复杂但是熟悉看裸K的朋友也是能看出5月阳线一半位置非常关键,新月基本上也是守住了,周线BOLL中轨得到支撑先看反弹力度,日线收敛三角突破,4小时短线上5次测试3355一线得到支撑。
ETH现货ETF通过预期一直还在炒作,大部分人都是害怕错过突然的爆拉,同时又担心大饼会向下大跌摇摆不定,而预期通过时间再从7月4号推迟至7月8号。
支撑:
压力:
如果你喜欢我的观点,请点赞评论分享,我们一起穿越牛熊!!!
文章具有时效性,仅供参考实时更新
专注k线技术研究,共赢全球投资机会公众号:交易公子扶苏

免责声明:本文章仅代表作者个人观点,不代表本平台的立场和观点。本文章仅供信息分享,不构成对任何人的任何投资建议。用户与作者之间的任何争议,与本平台无关。如网页中刊载的文章或图片涉及侵权,请提供相关的权利证明和身份证明发送邮件到support@aicoin.com,本平台相关工作人员将会进行核查。


