每日分享
大饼昨天反弹后没能再次突破64370,反而再次下探到62000附近,下午插针到了61900附近,那么目前来看,大饼这里始终没能走出一波上涨的驱动浪,所以大饼短线有可能再次回踩59000附近去延伸这笔从73777开始的日线级别的回调。
大饼的日线,此前我们说过了,如果大饼4h级别的反弹不能突破70500的话,那么后续还会走一笔4h级别的回调去到56000~59000区间的。那么实际的行情正如大家所看到的那样,别说70500了,连68000都没有摸到。但是这里里面结构上有一点是我们始终不好判断的,那就是比特4h级别的结构没能走出来,或者说大饼没能成功的走出上、下、上三笔1h级别的结构,这就导致我们无法准确的去判断4h级别的反弹到底有没有走完。
今天短线已经触及到了62000附近,并且向下插针到了61900,如果晚上或者明天再次跌破了62000并且不能快速的收上来,那么大饼短线无疑将再次跌破59600,有可能到59000附近,也可能插针到56000~59000区间。
如果今晚乃至明天始终跌不破62000,则4h级别的反弹还有可能没有结束,耐心观察。
大饼短线由于下跌的非常缓慢,处于一种慢慢震荡,偶尔反弹然后阴跌的状态,再加上4h级别的结构已经走了很多笔了,所以个人认为大饼极限下跌的位置很难跌破55000。大饼这里的震荡回调,有点类似于去年4月14日~6月14日的那段回调,看着吓人,像是要跌很多很多的样子,实际跌不了太多。所以当前应该说处于黎明前的黑暗,保持谨慎乐观就行,牛市里悲观就没必要了。
BTC
短线由于行情变化较快,文章只能对发布那一刻的行情变化做出预判,短线玩家注意行情最新的变化,仅仅作为参考即可。
1H:

在前面的文章中,我们说大饼保持在62000上方,还要希望继续走出一笔反弹去67000附近或者上方看4h级别反弹的延伸。跌破62000则可能进一步再次回踩59000附近。那么大饼当前已然跌破了62000,当然这里跌破属于插针的形式,我们当前可以观察下,如果后续实体k线跌破了,那基本上还会有继续下跌,下方关注59000附近或59000~56000区间即可。
从当前盘面看,62000应该撑不住,做好再次回踩59000附近的准备。
15M:
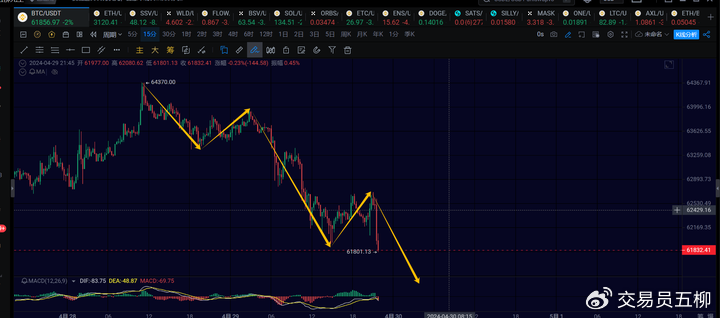
15分钟级别,当前应该在运行第五笔15分钟级别的下跌,下方关注60500附近
ETH
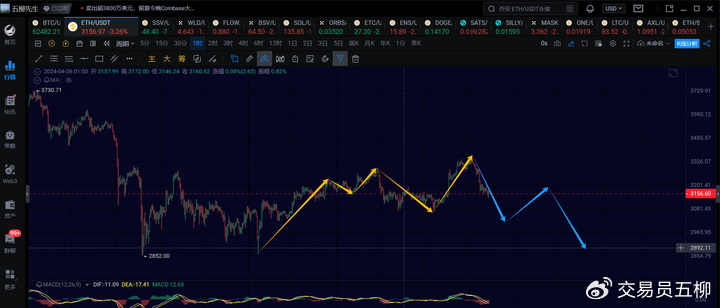
以太昨晚反弹的力度不行,没能加速拉升,那么这里以太很有可能要走一笔新的4h级别的下跌,如果走出了4h级别的下,那么预计就可能再次回踩到2800~2850区间。当前是第一笔1h级别的下跌,这笔下跌还没有结束,关注下方3030的支撑。

以太昨晚根据我们的预期回踩到3270附近后再次走出第三笔15分钟级别的反弹,但是第三笔反弹力度不及预期,没能加速拉升,所以今天直接走出了1h级别的下跌,目前已经1h的下已经走出了第一笔15分钟级别的下,预计还会有第二笔15分钟级别的反弹和第三笔15分钟级别的下跌。短线反弹关注3200附近,第三笔15分钟级别的下关注3050~3000附近。
山寨币:
目前大部分的山寨币还是处于低位震荡中,不是山寨币不涨,而是大饼以太这领头羊暂时也没有走出上涨趋势。可以预见的是,如果大饼再次回踩59000,很多山寨应该会再次回踩4月14号插针的低点附近或下方一点。但想要再次跌很多很多,概率不大。
趋势方向
周线级别:方向向上,目前是自15476开始的周线反弹的延续,何时结束关注后续日线情况
日线级别:方向向下,短线继续向下延伸日线下跌的概率偏大
4小时级别:方向向下,62000有些撑不住了,可以再观察观察,跌破继续看59000
1小时级别:方向向下,短线下跌还没走完,后续应该还要再次下跌
15分钟级别:方向向上,短线看15分钟级别反弹的力度,上方阻力63300
欢迎大家关注我的公众号一起讨论交流:

文章具有时效性,注意风险,以上仅个人建议,仅供参考!
免责声明:本文章仅代表作者个人观点,不代表本平台的立场和观点。本文章仅供信息分享,不构成对任何人的任何投资建议。用户与作者之间的任何争议,与本平台无关。如网页中刊载的文章或图片涉及侵权,请提供相关的权利证明和身份证明发送邮件到support@aicoin.com,本平台相关工作人员将会进行核查。


