
The feeling of Bitcoin reaching $30,000 again has never been better, especially after fluctuating between $25,000 and $27,000 for a long time.
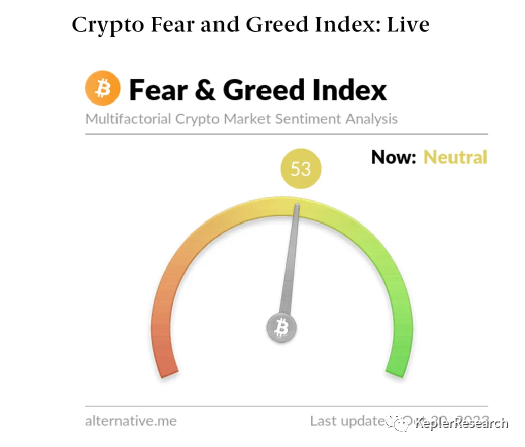
Surprisingly, this occurred when the cryptocurrency fear and greed index was considered "neutral," although it is now transitioning to a "greedy" state.
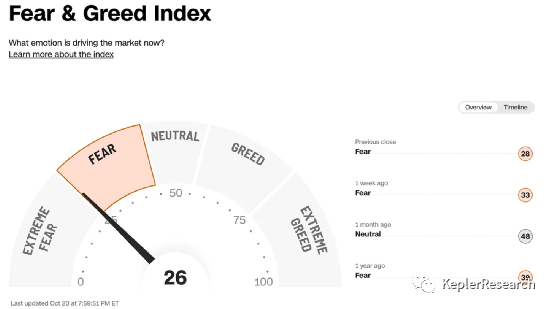
Equally astonishing is that Bitcoin has risen to $30,000 while the stock market fear and greed index is on the verge of "extreme fear"!
A lot has happened in the past two weeks, and in today's research, we will carefully examine the price dynamics: "Due to the false news released by Cointelegraph and Benzinga about Blackrock's Bitcoin spot ETF being approved by the SEC, the Bitcoin price touched $30,000 in the past week, forcing both longs and shorts to be squeezed out by over $100 million."
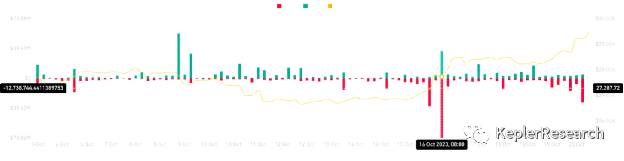
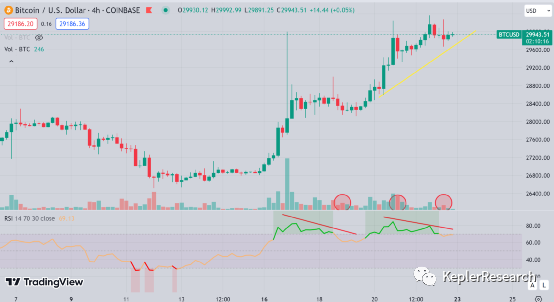
Surprisingly, after the news was confirmed to be false, buyers did not leave the market but chose to stay at a price above the support level of $28,000. For us, this is very optimistic from a price structure perspective, and $28,000 is clearly the level for our bullish view.
As stated in our article published on October 9: "We hope to see Bitcoin return to above $28,000 to initiate a potential rise to $32,000. From our perspective, the $28,000 level is a bottom line, whether we are returning to a bullish state or continuing to be weak, $28,000 is different."
The narrative of Bitcoin has not fundamentally changed, but with the rise in price, we have seen strong demand, and the fact that the entire move was driven by false news amplified this demand. Seeing how many people are waiting for positive news is the first sign of establishing a Bitcoin position. We witnessed how large the incoming funds were, so we believe that more traders are afraid of missing out on this future trend and are pre-positioning.
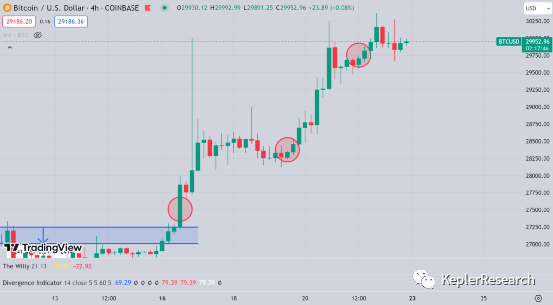
We can see that the RSI is currently diverging from the bearish trend over the past few days. Bitcoin made the first divergence invalid and is currently testing the second divergence while at the resistance level of $30,000. Typically, this would be a clear bearish signal, but Bitcoin has tested the resistance level three times so far, and each retracement from the test has decreased, showing the strength of the buyers.
Bitcoin On-Chain Indicators
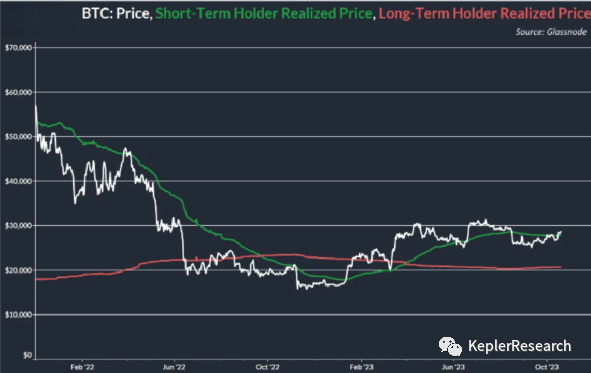
Realized Price
After a positive price trend this week, Bitcoin has regained the cost basis of short-term holders. Viewing this level as support over the weekend would be a good sign, indicating that these (small) price increases will persist in the short term. Clearly, in the medium to long term, there is still significant upside potential for the price.
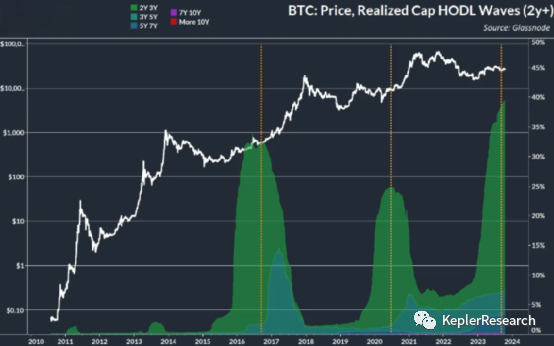
Realized HODL Waves
Nearly 40% of Bitcoin's realized cap comes from tokens that have not moved for 2 years or longer; reaching a historical high. From all indicators, Bitcoin's liquidity has reached record levels. If the demand for the approval of a Bitcoin spot ETF matches, then the shortage of supply liquidity is like charcoal, firewood, and kindling. The 2024 halving is a gallon of lighter fluid.
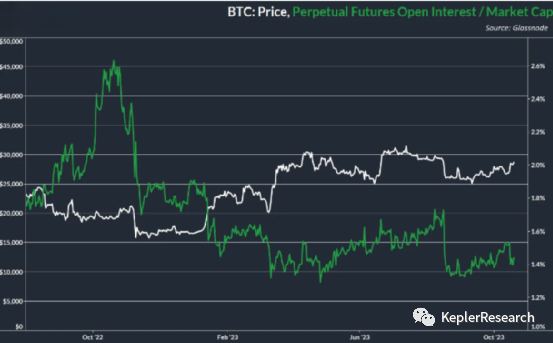
Perpetual Futures Open Interest/Market Value
Due to the volatility caused by false news, open interest contracts were heavily hit on Monday. Additionally, the continued upward trend in prices this week is spot-driven, and the further decrease in open interest relative to market value proves this. Lowering market leverage when faced with too many bullish catalysts is a good sign.
Note: All content represents the author's personal views and is not investment advice, nor should it be interpreted in any way as tax, accounting, legal, business, financial, or regulatory advice. Before making any investment decisions, you should seek independent legal and financial advice, including advice on tax consequences.
For more content, follow: KeplerResearch on WeChat and @kepler008 on Twitter

免责声明:本文章仅代表作者个人观点,不代表本平台的立场和观点。本文章仅供信息分享,不构成对任何人的任何投资建议。用户与作者之间的任何争议,与本平台无关。如网页中刊载的文章或图片涉及侵权,请提供相关的权利证明和身份证明发送邮件到support@aicoin.com,本平台相关工作人员将会进行核查。


